
Subscribe
Alert Me when new Data Products are available


In developing our products we have created a number of important tools and weighting tables. We can therefore create many different custom-designed solutions for your demographic data and geographic data needs that go beyond the capabilities of our standard products. Sometimes we use these tools to manipulate the data extracted from our products to better suit your particular needs and sometimes it is to create something that cannot be done with our products alone.
Below is a list of the reports and services we provide. To get more details about any of these projects or if you have other data needs please call us at 800-577-6717 to discuss your requirements with us.
Demographic Reports (and Maps)
Custom Reports
You select the variables you want for the current US population and the year (1970-2000) and we will generate the map or report to meet your needs.Area Segmentation
If you give us the parameters that define your target audience we can calculate all of the areas that meet your specifications and put them in rank order.Area-to-Area Correspondence Files
How two geographies relate to one another. For Example, what County is a given Zip Code in?Banking and Realtor Tract Level Data and Maps
We can provide you with all of the tract level demographic maps (including geocoding) to file your forms with federal or state agencies.
Geocoding
We can geocode your entire database of addresses and will also append Census demographic data to the addresses to enable profiling of your customers. We have a set of 60+ variables but can customize it to meet your specific needs.Custom-built Databases / Full Product Development
We have built several full datasets with complete functionality (data export and mapping capabilities). We have a GSA contract and are able to create entire packages to suit your agency's needs.Normalizing Data
We can translate data from one time period to another (i.e. 2000-to-1990 or 1990-to-2000). We can normalize data sets for you based on our own data (i.e. Census 2000 data translated back into 1990 boundaries) or if you have your own dataset that you want normalized we can do that. For example, data that was collected in 1996 will be based upon the 1990 boundaries but we can normalize it to the 2000 boundaries so that you could compare it with current data.Database Compression
Our compression technology allows a 90-95% reduction in storage space AND faster access to the data. Our access technology does not require un-compression to read the data and thus is significantly faster than accessing the data in an uncompressed form.
Custom Reports - We regularly run custom reports for individuals and agencies providing just the variables needed for the area specified. Sometimes it is a site selection radius around a potential location that a customer is thinking of developing and needs to know how many people there are within 3 miles and what their income levels are. Other times it is information about ethnic breakouts by tracts across a state or the country at large. These are generally run right out of our products and are usually purchased by groups that do not need the complete software for the target marketing. These customers generally only need one set of answers and a custom report is a quicker and simpler solution. Reports start at $150.
Area Segmentation - We can create a specific weighting file to determine which parts of an area qualify using your agency specifications. You tell us what your target audience has as its characteristics and we will rank order the entire area by how well it correlates with your target market research.
For example, we created a weighting file for a state government agency that needed to determine which Block Groups in their state met the mandated definition of "Distressed Block Groups". In their state to be "distressed", it had to meet at least 5 of 8 indicators (high unemployment, low high school graduation rates, high child poverty rates, high senior poverty rates, high single-mother with children in poverty rates, low per capita income, a high percentage of minorities, high percentage of multiple people sharing living limited space). This file will then be used to determine which block groups are distressed and the level of distress. The government agency will then use this as the method for determining where to invest in programs, where to offer additional resources, and what areas qualify for different funding sources. We can custom tailor the variables used and the cut-offs to meet whatever your agency or state needs require. The pricing for this sort of project is about $2,500 depending upon the constraints.
Area-to-Area Correspondence File
The United States Census Bureau (USCB) defines many geographies as subsets of a larger geography (ie. counties in the state). But there are also many geographies that the USCB does not define as subsets of each other. The smaller area must be wholly contained within the larger for all parts of the country to allow this sub-area definition. Zipcodes (or school districts, etc) are areas that are not sub-areas and do not allow smaller geographies (Tracts and Block Groups) to be sub-areas of them. Thus if someone wants to know what county a zip code is in or what tracts are in a given zip code this is not something that the USCB data will answer. Because of this shortcoming of the USCB data, we have created the Area Correspondence File to answer such questions.
Different groups will have different specific needs so we have built-in flexibility with this program. There are two sets of selections so as to best meet your needs: Dominant area vs. All available and Weighting by Population vs. Land area.
Dominant area vs. All available
When subdividing an area into different geographies often there are splinters (tiny areas) created. For example, zip code 35006 is 98.13% in Jefferson County. For some analysis, all that is needed is the dominant (single) answer - Jefferson County. For some analysis however you may want to know where the other 1.87% is (Tuscaloosa County in this case). Sometimes it is also not so clear as this example. 98.13% can easily be rounded to a single answer, but what if instead the zip code was split in three at 42%, 40% and 18%. Is it sufficient to know that 42% of the zip code is in the "dominant" county?
Weighting by Population vs. Land Area
In the past, the only way to do this was to layer one map on top of the other. This methodology is crude and prone to inaccuracies - it is also a very long and tedious process.
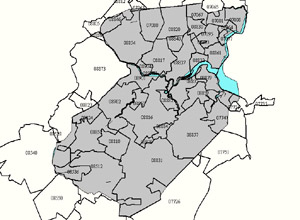
Below is a map of Middlesex County NJ. The gray area is the county line, superimposed over it are the zip code boundaries. As you can see in the blown-up version on the right, zip code 08540 has a small corner that is within the county lines, but most of it is outside the county. Likewise, most of 08512 is within the county, but not all of. If you do this manually then the question is "what proportion of the population in 08540 do you attribute to Middlesex County and what proportion of 08512 do you subtract?"
 |
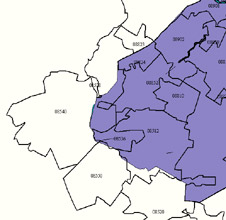 |
These maps were both produced from our CensusCD 2000 Long Form by layering zip code boundaries over the county data.
The layering of maps creates a weighting by land area. For example, in a downtown business area where there are very few residents, weighting by population may not be as desirable. If on the other hand you want to weigh areas that are populated, then the way to normalize it more precisely is to look at where the people are located as a way of determining how to allocate the percentage coverage.
We can create a correspondence between any two geographic areas in 2000. So for example we could tell you zip codes in an MSA or tracts in a Place, etc. These reports start at $350.
The methodology for creating these reports is available (click here for more information).
Banking/Realtor Tract Level Data and Maps
We can create maps for an individual census tract or for all of the tracts in a county. We can also generate racial and economic breakouts for the tracts for federal filings. We have run reports for banks to select the racial and economic data for each of the tracts that they have made loans in, as well as the county they are in and the surrounding counties. These reports are generally $150 - $450 depending upon the complexity of the request.
Geocoding Services - Geocoding takes an entire database of addresses and assigns the appropriate latitude/longitude coordinate to each address. It then assigns the Census Block for that coordinate. Our GeocodeDVD goes one step further. We can now assign the 1970 Census Tract, the 1980 Census Tract and Block Group, and the 1990 Census Block Group. So if you need to append historic census data to your address list, we can run your list and append these older census year tract and block group coordinates for you. As a default we will append to each address up to 60+ demographic variables based on the 2000 Census Long Form. For an additional fee we can also append the latest current year demographic estimates and 5-year projections to each address.
Our services also allow us to customize the demographic data appended to better meet your specific needs. Appended data will allow you to profile your customers or identify locational differences between addresses. Customers normally purchase our GeocodeDVD and geocode their address lists themselves, but if you don't want to have to do it yourself, we would be happy to do it for you. The pricing will depend upon the number of addresses being geocoded and whether or not we need to append custom selected variables.
Custom-built Databases / Full Product Development
Below are two examples; one is a dataset, the other an entire product designed to meet the specific requirements of two organizations. A third example is the Neighborhood Change Database, which we built for the Urban Institute, with funding from the Rockefeller Foundation.
Housing and Urban Development (HUD)
HUD awarded GeoLytics Solicitation number Q1Q-NCS-P0014 to Develop a Data Access Tool for 1990 Census Data STF4 Tables 59 & 60. These data provide detailed information regarding housing conditions, and are of great importance to HUD economists. GeoLytics was asked to develop a database "Housing/Data Access Tool" (H/DAT), that would allow HUD personnel who need to access these data an easy way to select, process, report, and map these data.
During this project it was necessary for GeoLytics to import, clean, validate and then process the original data. The data was then converted into a proprietary compressed format. The final product has a menu-driven interface that allows the user to form his/her own queries and thus create his/her own custom set of data from these tables. To make the reporting more powerful we also added a mapping component that displays the various geographic levels.
National Economic Research Associates (NERA)
NERA has over 40 years of experience offering expert economic consulting services. NERA economists devise practical solutions to highly complex business and legal issues arising from competition, regulation, public policy, e-commerce and strategic business decision-making. They create strategies, studies, reports, expert testimony and even policy recommendations based upon their years of specialized study.
NERA was working with a client's database file of nearly 300,000 records that contained data at the 1990 Block Group level. In order to do the required analysis they needed the 1990 Block Group data normalized to 2000 Block Group definitions. And then they needed 2000 Block Group data appended to each record in the database file. In just a few days we were able to give them the exact data set that they needed appended to the existing file so that they could continue their analysis.
Database Compression
Our compression services allow large amounts of information to be conveniently stored and accessed on CDs. With numeric data, we can achieve a 90-95 percent reduction in storage size. On average our compression of numeric data is half the size of data compressed by other methods. Because our access technology does not require un-compression to read the data and thus is significantly faster than accessing the data in an uncompressed form. Furthermore, our compression allows direct access uncompression within the compressed file so that you can "build" a fully-indexed compressed database that you can access and uncompress anywhere within the database without uncompressing the entire file.
For example, we have achieved the following compression results:
The compressed data is easy to access with built-in utilities and library functions. Our compression utility designed for dBase files can also be modified for any database format. Additionally, we have an ArcGIS shape file compression utility that can be modified for any spatial data where the format is available.
Our compression technology has been incorporated into ESRI's Arcview Business Analyst. We were employed by ESRI to compress several large sets of data (Population Estimates, Population Projections, Dun & Bradstreet's Business Reports database, along with a database of consumer expenditures for over 90 million households). All of these, and the boundaries, were compressed onto two disks (the requirements from ESRI). With compression, not only was it easier for the user to manage the datasets, but because of our technology the user was able to access the data much faster - without having to uncompress it.
The capacity and speed of this technology is also showcased in all of our CensusCD products. Pricing for data compression varies according to the size and type of data to be compressed. Please contact us for further information and pricing.
Normalizing Data - Weighing data from one time period to another
It can be crucial to analysis to see how an area has changed over time. Unfortunately, the US Census Bureau re-defines many of the geographies each time it does the census. Thus making time series analysis almost impossible. We have created two products to address the problem of shifting geographic definitions.
Our product Neighborhood Change Database uses tract level data and normalizes a subset of 1970-1980-1990 data to the 2000 boundaries. We also have created the CensusCD 1990 Long Form in 2000 Boundaries, which gives you access to all of the 1990 Long Form data in all of the 2000 Long Form boundaries.
We can supply you with normalized data from our data sets. If your methodology does not conform to either product listed above, we can custom tailor the variables you want to the geographic boundaries that meet your specific needs. In developing the weighting tables for these two products, we also developed the ability to weight a file in the opposite direction. Whereby you can take a file of 2000 data and geographies and weigh it back to the earlier boundaries. We can also weight data from 1970 or 1980 to the 2000 tract boundaries for variables that were not included in the NCDB. So for example, if you want age breakouts and they are not in the NCDB we can do that as a custom weighting report.
We can normalize your existing data. Sometimes you will already have a dataset that has either census boundary definitions or addresses that need to be updated to the 2000 definitions. We can take your dataset and normalize it using our weighting tables and return to you the new, normalized data based on the new geographic boundary definitions.
Weighting analysis projects begin at $1,000. It may cost more if multiple time periods are involved or if the geographic level is not one for which we have already generated the weighting table.
Methodology for Area Correspondence
Historically the only way to establish a correspondence between two areas is to layer one map over another and then try to determine the correspondence by calculating or guestimating the overlap. Instead, what we have done is to examine the Block level data. At the Block level, the US Census Bureau has enumerated all of the geographic identifying fields. So a Block is associated with all other geographic data. Thus by summing and weighting Blocks we can determine the correspondence between two other geographies using Block level data as the measure. We have taken the entire Block data set for 2000 (approximately 8.2 million blocks) and then determined the geographic boundaries of each level of boundaries based on blocks. From that we can create weighting tables for the blocks that are contained in one geography to the blocks contained in another geography. So for example if you want to see what the relationship is between the zip code and county we can determine what blocks are in a given zip code (i.e. 08540 from the example above). In this zip code the population by Block are 76.17% in Blocks contained in Mercer County. The remaining 23.83% are split between Middlesex County (11.9%) and Somerset County (11.93%).
This procedure can be done with the purchase of our CensusCD 2000 Short Form Blocks or Redistricting Blocks. As a warning, however, it is very time consuming and difficult to manipulate a data set of 8.2 million Blocks and should not be entered into lightly.