Subscribe
Alert Me when new Data Products are available


Neighborhood Change Database (NCDB) gives users instant access to US Census data from 1970, 1980, 1990, 2000, 2010 and 2020 at the census tract level. This easy-to-use product was initially developed in association with The Urban Institute and partially funded by The Rockefeller Foundation. It is an invaluable resource for policy makers, community organizations, and researchers who want to analyze changes that have occurred in US neighborhoods over six decades. The NCDB contains 1970, 1980, 1990, and 2000 Long Form data and the 2010 Summary File 1 (SF1), 2010 American Community Survey (ACS), the 2020 Demographic and Housing Characteristics (DHC) and the 2020 ACS. These data sets include details such as: population, household, and housing characteristics, income, poverty status, education level, employment, housing costs, immigration, and other variables.
Selecting Data Format - Regular vs. Normalized
You can access the data for 1970, 1980, 1990, 2000, 2010 or 2020 in their census year tract boundaries. In this way, the data will appear as it did for that census year and the maps will be drawn according to that year's boundaries. For example, you can view the 1980 data in the 1980 tracts. With Neighborhood Change Database, however, you can also access data for all six decades normalized to 2020 tract boundaries. This lets you view and display data as if the 2020 tracts existed and all the data is weighted to these areas. Thus you can compare 1980 data with 1970, 1990, 2000,2010 all compared to the 2020 data since they are all in the same 2020 tract boundaries.
The All years normalized to 2020 selection allows you to compare data for various years. The data for years 1970, 1980, 1990, 2000 and 2010 are recalculated and normalized, and the report uses the 2020 tract ID (FIPS code). This allows you to compare data for various years within the exact same boundary definitions. By selecting "All years normalized to 2020" you can do actual apples-to-apples comparisons of historic data in 2020 tract definitions.
Please Note: Not all of the US was tracted in 1970 and 1980, so there are some rural areas that will not have data for 1970 and 1980 in this product. Contact GeoLytics if you are concerned about coverage in 1970 and 1980 in your area of research interest. See example below of Atlanta, GA.
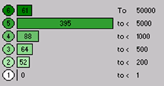
Example: Visualizing Atlanta's Population Density, 1970 to 2000
The example below of Atlanta Population Density from 1970 to 2000 is a case in point. With the NCDB, users can produce maps of populations and landmass for 1970, 1980, and 1990 census data already weighted to the 2000 boundaries. In one pass, the computer will be able to generate the data and boundaries and map these trends. With another minute, you can calculate a variable for population density. Quickly, you are printing, saving, and producing impressive thematic maps that visually illustrate Atlanta population growth through time. All in only a matter of minutes!
| Changing Population Density 1970 to 2000 - Atlanta, Georgia | ||
1970 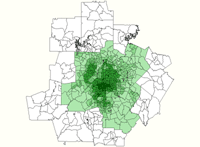 1990 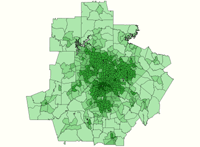 |
  |
1980 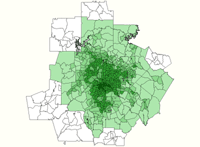 2000 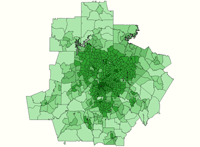 |
What are the differences between the Neighborhood Change Database and the individual census products for 1970, 1980, 1990, and 2000?
The Neighborhood Change Database has two main advantages: normalized data and cost. If you want to do time series analysis (looking at the changes of a given location across time), then the Neighborhood Change Database is the ideal product. Because the NCDB data is normalized, you can evaluate population trends without having to control for changes in boundary definitions. The year specific boundaries are also included and if you only need tract level geographies, this is a much more cost-effective way of purchasing six5 decades of Census data for the price of three.
The Neighborhood Change Database is not as exhaustive as the full census because the data are only expressed at the tract level and include a subset of the complete variable list for each decade. However, the NCDB does have an extensive subset of census variables - about 1,000 variables for each decade. Furthermore, these variables have been defined to make it very easy to compare data across censuses. The complete set of census variables is available on the individual CensusCD products. The CensusCD 1980, 1990, and 2000 have an additional geographic level of block group (which is about 3-4 times smaller than a tract). We also offer data for 1990 and 2000 that go down to the Block level (40 times smaller than a Block Group). The other main advantage to the census year specific products is that you can easily run reports for areas larger than tract level. For example, if you wanted state numbers for each of the 50 states with the NCDB you would need to run Summary Reports 50 times or sum up the tract level data to the state, though this is not possible in 1970 and 1980 when the country was not fully tracted.