
Subscribe
Alert Me when new Data Products are available


↓ Features
↓ Variables
↓ Geography
↓ History
Neighborhood Change Database (NCDB) gives users instant access to US Census data from 1970, 1980, 1990, 2000, 2010, and 2020 at the census tract level. This easy-to-use product was initially developed in association with The Urban Institute and partially funded by The Rockefeller Foundation. It is an invaluable resource for policy makers, community organizations, and researchers who want to analyze changes that have occurred in US neighborhoods over six decades. The NCDB contains 1970, 1980, 1990, and 2000 Long Form data, the 2010 Summary File 1 (SF1) and 2010 American Community Survey (ACS) as well as the 2020 Demographic and Housing Characteristics data set and the 2020 ACS. Thes data sets contain variables such as: population, household, and housing characteristics, income, poverty status, education level, employment, housing costs, immigration, and other variables.
| Basic | |
|---|---|
| State User | $1,495.00 |
| National User | $2,895.00 |
The data in CensusCD Neighborhood Change Database are constructed from an extensive subset of the Census variables for each decade (about 1,000 variables for each year).
The data in the Neighborhood Change Database is:
A big improvement in the 2020 NCDB is that we have now categorized each of the variables into a set of Groupings:
Within each of these Groupings there can be multiple Categories/Tables. For example, in the Grouping Income there are 8 Categories: Family Income, Families by Income, Household income in the past 12 months, Per Capita income in the past 12 months, Earnings, Household Income, Households by Income in the past 12 months, and Median Household income in the past 12 months. Within each of these Tables there can be many variables. Here is the 2020 ACS Income category.
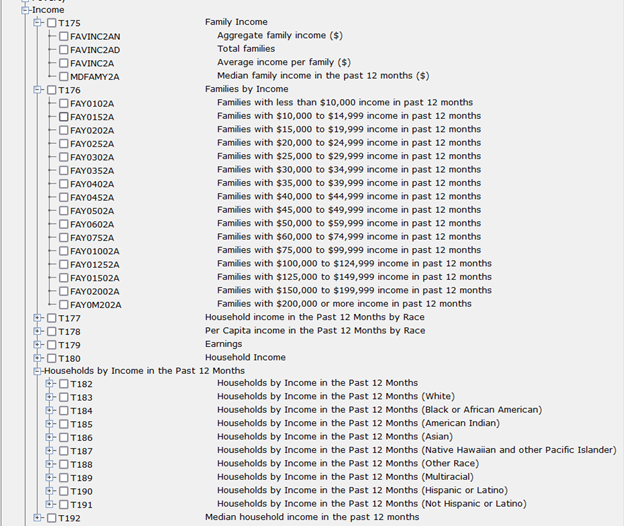
You can see that this is a much easier way to find all of the income variables all in one convenient place. We have also gone back and applied the exact same groupings to the previous census data sets. For a more complete description of the variables, geographies and methodologies please refer to the Data Users' Guide. The individual sections are pdfs, their size is indicated in parentheses:
The Neighborhood Change Database is based on the geographic unit of the Census Tract. The Census Tract is the Census Bureau's statistical equivalent of a large neighborhood (with an average of about 4,000 people).
You can select any of the 6 geographical levels:
The 1970 and 1980 censuses did not have full tract coverage of the US. The tracts are predominantly located in urban areas. By 1990 the US was fully tracted and all parts of the country were covered.
The actual remapping procedure for converting data from 1970, 1980, 1990, 2000 and 2010 tracts to 2020 tract boundaries is quite complicated. Those wishing more a technical explanation of this task should consult Appendix J of the Data Users' Guide (PDF). The basic procedure was to use geographic information system (GIS) software to overlay the boundaries of 2000 tracts with those of an earlier year. This allowed us to identify how tract boundaries had changed between censuses. We then used 2000 block data to determine the proportion of persons in each earlier tract that went into making up the new 2010 tract. For example, if a 2000 tract split into two tracts for 2010, the population may not have been divided evenly. Our method allows us to determine the exact weight to allocate to each portion. This same idea was then applied to to convert from 2010 to 2020.
These population weights were then applied to the various 1970, 1980, 1990, and 2000 tract level NCDB variables to convert them to 2010 tract boundaries. The population weights were used to convert all variables based on counts of persons, households, and housing units, all counts based on subpopulations (such as black persons or elderly households), and all aggregate data (such as aggregate household income). Proportions (such as the proportion of Hispanic persons) were remapped by first converting the respective numerator and denominator values (Hispanic persons and total persons, respectively) and then recalculating the proportion.
Understanding how neighborhoods change over time is fundamental to addressing the problems and opportunities of America's communities. Many people are not aware, however, that data obtainable from the U.S. Bureau of the Census cannot be used directly for these purposes, because of many changes in census tract boundaries and variable definitions between census years. In the early 1990s, with funding from the Rockefeller Foundation, the Urban Institute made adjustments as necessary to create the first national data file with consistently defined tract level census data for 1970, 1980 and 1990. That file has since been used as the basis for important research on how the nation's communities changed over those decades.
Rockefeller has again provided funding to allow the Urban Institute to add 2010 census data to the file. To do so, the Institute has collaborated with GeoLytics again. In 2005 GeoLytics added the 2000 data and also transformed the product to make it much more user friendly and technically superior to the earlier version in a number of respects. GeoLytics applied their proprietary weighting tables for 1970, 1980, and 1990 to carefully convert past census data to new 2000 tract boundaries. This procedure allows NCDB data to be accurately compared over time for the exact same geographical boundaries.
In 2010 the NCDB was released on CD and then Online using GeoLytics' proprietary data compression and mapping technology. The data can be accessed using the menu-driven mapping and analysis software or the data can be extracted for use in external database, mapping, and analysis packages. The collaboration has drawn on the strengths of both organizations, and resulted in a product that is a significant tool for policy-makers, researchers and community practitioners interested in neighborhood change.
Our big improvement in 2020 is a reorganization of all of the variables. All of the same variables are included but now they are organized into 11 themes: Population, Age – Sex, Race, Journey to Work, Households – Families, Education, Language, Poverty, Income, Employment, and Housing. This makes finding variables much easier and the organization is the same across all of the decades so ensuring that the variables match is easier than ever.
We offer several delivery options for our products. You can use
In each case the data is exactly the same and most of the time the product has the same functionality. Our new downloadable desktop version has some new features built in, like the ability to build your own variables or correlations.
Below are the ways to obtain a Users’ Guide for each type of product.
Downloadable Desktop products
For more videos please go to our resources page at https://geolytics.com/products/new-software-interface
Video Users Guide for our Online Product versions
https://www.youtube.com/watch?v=vqP90uKeqIg
User Guides for our CD/DVD/USB versions are on our website at
https://geolytics.com/user-guides
Generic one is is https://geolytics.com/media/pdf/New-2003-User-Guide.pdf
