
Subscribe
Alert Me when new Data Products are available


↓ Features
↓ Variables
↓ Geography
↓ Guided Tour
CensusCD 2000 Short Form provides details about the population of the United States. Short Form (SF1) is a 100 % count sample. It has variables including race, Hispanics, age of head of household, age of children, presence of older relatives, composition of the family, family size, rent vs. own, etc. It has 8 levels of geography: State, County, Tract, Block Group, MCD/CCD, Place, Congressional divisions and Zip (ZCTA).
CensusCD 2000 Short Form is essential for two key pieces of information that are not available on the 2000 Long Form (SF3): Group Quarters and Country of Origin for Hispanics and for Asians. If you are interested in populations in specific types of group quarters (correctional facilities, nursing homes, student dorms, military barracks, etc.), then the SF1 is the only source of data. Likewise if you want the specific country of origin for Hispanics and Asians, you must consult the 2000 Short Form.
The US Census Bureau created nearly 5000 tables (approximately 10,000 variables) that deal with racial and ethnic breakouts on the 2000 Long Form, thus enabling analysis of how Hispanics are faring compared with Whites, Blacks, Native Americans, Asians, Pacific Islanders, and multi-racials. But in 2000, the specific table of Hispanics by Country of Origin was not included in the Long Form as it was in the 1990 Census. Instead, it was left on the Short Form (SF1).
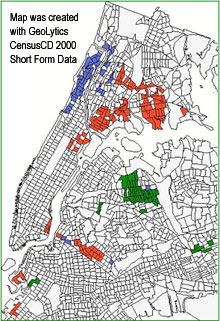
When analyzing NYC, this example looks at the distribution of three different Hispanic groups that are located in distinct neighborhoods throughout the city. For this analysis, any tract that had less than 100 persons was dropped. For Puerto Rican neighborhoods, all tracts that had over 35% Puerto Rican population were chosen. For Dominican neighborhoods, tracts that had over 24% Dominican population were chosen, and for the Central & South American Neighborhoods tracts with at least 20% of its population from these areas were chosen.
Red Tracts represent Puerto Rican tracts, Blue Tracts are predominantly Dominican, and Green Tracts are Central and South American Neighborhoods. The map illustrates that Puerto Ricans predominate throughout the Bronx and in sections of Brooklyn and Queens. Dominicans have neighborhoods concentrated primarily in upper Manhattan. While Central & South Americans congregate in northern Queens.
| Basic | |
|---|---|
| State User | $349.00 |
| National User | $695.00 |
| 2000 SF1 variable list | ✪ 8186 variables |
The variables include race (and Hispanic designation), age of head of household, age of children, presence of older relatives, composition of the family, family size, rent vs. own, etc.
The CensusCD/2000 Short Form has data at 8 levels of geography:
CensusCD 2000 SF Guided tour will step you through the whole process of how to create data reports and work with maps. Start with "Data" for a look at the different ways you can generate data from either program or start with "Maps" to see the mapping features of CensusCD 2000 SF.
CensusCD 2000 SF is a powerful yet straightforward and easy to grasp tool.
You need to look up information or create a report... OK, just follow these five steps from the main menu:
1. Select Area
2. Select Subarea
3. Select Counts
4. Select Run
5. Select View
Sometimes you want to cover all smaller units of a large unit. So you finish area selections on this large unit, go to Subarea menu and click one of the items offered there. Your report will be broken down into these smaller units; one report line for each of them.
CensusCD 2000 SF area selection is flexible. You can define a radius area.
Once the areas are done, you can select what fields will be in your report. Select counts from the main menu and you'll see census demographics neatly grouped in 15 categories. Click a category button to view the list of tables for these categories. Click a table to see the list of counts. Click a count to see it appear here and later in your report.
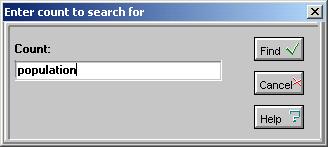
If you are not sure of the area, just click on search menu, enter information and click Find.
You can see all possible variations on the word "Boulder" in USA
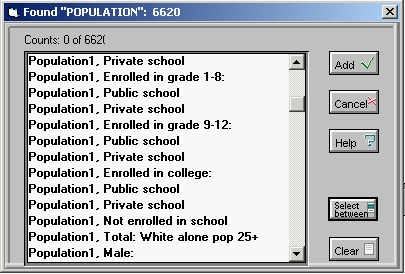
You can search for counts, too. Here we've used population as an example.
Easy to use options, allow you to focus your report on specific tasks and add-on features.
Now that you are all set, you can run your report.
See the progress bar moving. This may be especially useful if you are generating a very large report.
The report window is created when the report is done.
You can search, select, copy and print.
You can create charts using different algorithms.
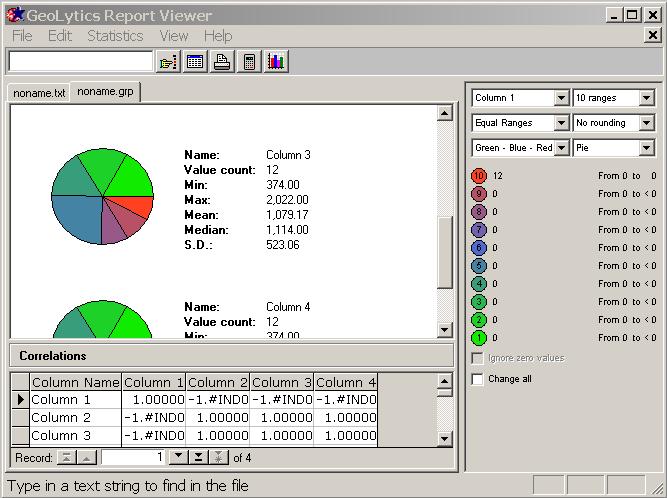
You can create the new fields on the fly using a formula calculator.
The status bar (located on the bottom of the application window) contains our "intelligent advice" messages that guide you every step of the way throuh the report creation process. Here is an example:

All this and many other things are explained in greater detail in our 25,000 line fully indexed help file.
You can also map your report:
The ABC of thematic mapping with CensusCD 2000 SF is simple. First you create a report.
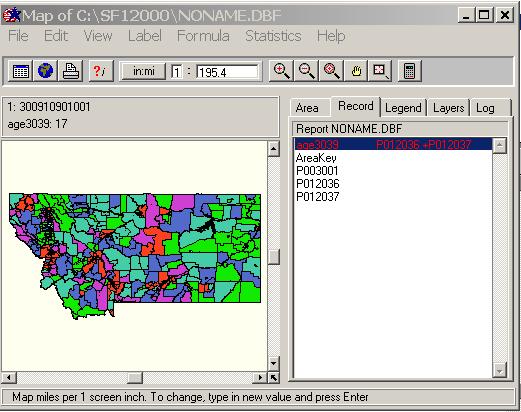
Let's take Montana as the area and select block groups as our subareas. You need to choose Census counts, too. Let's use Population1, Total Population and Sex by Age. Now you hit the Run Map button here:
The 35K report wil be created in a few seconds and now you see the map (we made it smaller than usual to save your loading time):
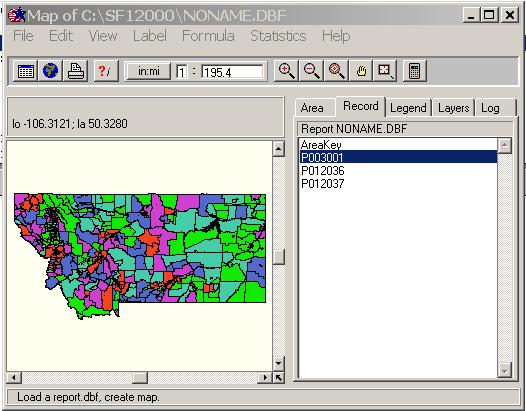
What you see is the distribution of the P001001 (total population) among Montana block-group using the "Equal counts" groupping algorithm with 5 ranges. It means, all areas were divided into 5 groups according to their values of P001001 so that each groups has approximately the same numbers of areas.
Suppose what you really need is to see the Sex by Age for Helena area and you want the areas to be sorted out into 5 groups, from 0% to 20% from P012037, from 20% to 40% and so on. Click on the P012037 line and see the map repainted. Now switch to the Stat Tab and select the Equal Ranges algorithm. What you see now is a differently colored map, mainly green because the P0112037 for the most of Montana block groups is far below the maximum. Now you need to zoom on Helena. Pick the Zoom Plus tool and click on the location several times. What you see is this:
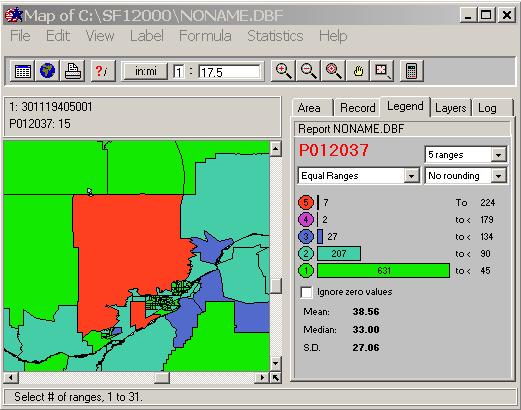
What is this gren tract ID? Click on it using the ?i tool and switch to Area Tab.
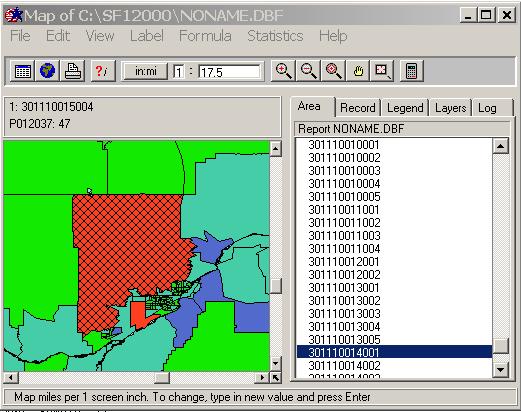
Aha. You see the whole block group 301110014001 highlighted. Where is 301110013005, by the way? Right, you simply click on the line above and see...
This style of mapping is simple and intuitive but you can do pretty sophisticated thing, too. Suppose you want to map a characteristics that is not in the report Counts but can be computed from it. Let's assume it is the Age: Female: 30-39. What you need, then, is to compute (P012036+P02037). This is what you can see if you hit the Calculator button:
You see the full list of all the fields in the report and a "keyboard". Just type your formula and give it a name.
and press OK. The new virtual column will be added to the list of the report fields.
Click on the new virtual column and you will see it mapped:
Of course this is only the ABC of thematic mapping with CensusCD 2000 SF. We have a lot of nice features. Among those are
... and more!
This is a great tool. Hope you will think so, too.
