
Subscribe
Alert Me when new Data Products are available


↓ Features
↓ Variables
↓ Sample Map
↓ Sample SIte Report
Our Site Report product is easy to use yet the results are very powerful. Site Report provides a comprehensive report of demographic data from the most recent American Community Survey (ACS), and the current year estimates, and 5-year projections in 3 rings around your target address. Population, race, income, education, and other demographic variables are delivered in detailed and accurate site reports. Site Report offers superior desktop power to run reports as needed and when needed, so you do not have to rely on expensive consultants to run reports for you. The Site Report interface is so user-friendly that anyone can use the software to explore business options and marketing potential.
Just enter a latitude and longitude or a street address, choose up to 3 distances to run as rings around your location, then hit OK. It's that easy!
The demographic data on our Site Report are based on the official US Census and from GeoLytics proprietary estimates and projections. The variable groups included in the Site Report are: Persons, Race, Households, Families, Language, Employment, Education, Disabilities, Veterans, Income, Poverty, Housing, Renters, and Owners.
The Census variables come from the latest American Community Survey (ACS)
The Estimated variables come from GeoLytics' Current Year Estimates
The Projected variables come from GeoLytics' 5-Year Projections
| Basic | |
|---|---|
| National User | $495.00 |
| American Community Survey Variables | ✪ 249 variables |
| Estimated variables | ✪ 51 variables |
| Projected variables | ✪ 51 variables |
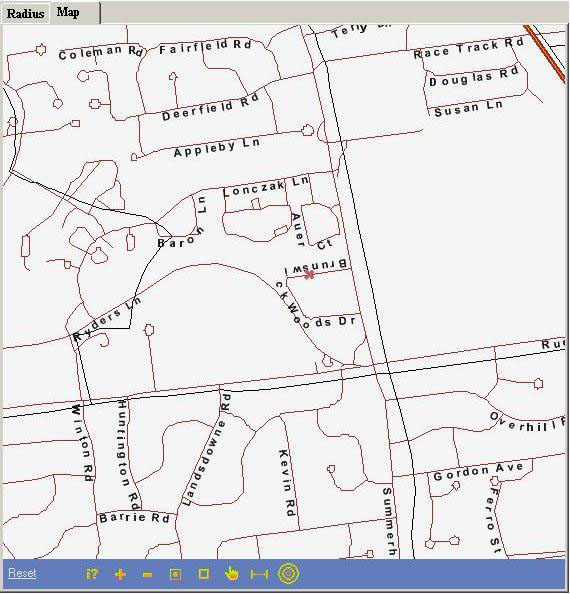
Our Site Report product comes with built-in mapping. The map will initially show you the exact location of your address with all of the streets labeled.
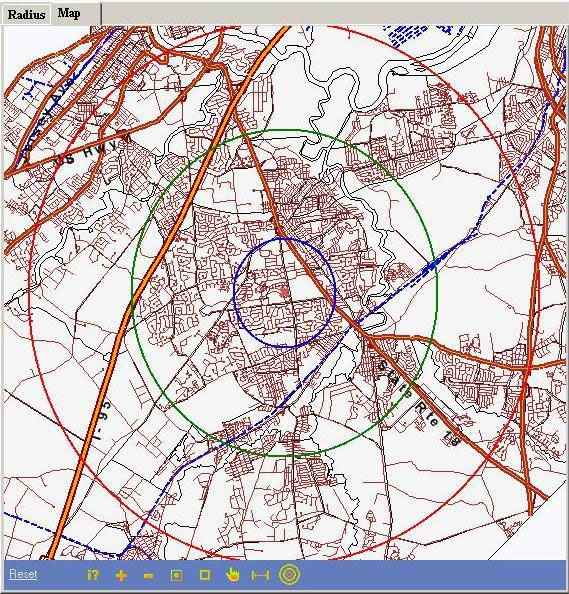
To see the three radii rings you can either zoom out or click on the "rings" button. As you zoom out you will then see only the major roads.
| DESCRIPTION | 1 mile | 2 miles | 3 miles |
| Age 5-9 | 977.00 | 3242.00 | 7138.00 |
| Age 20-24 | 771.00 | 2339.00 | 5556.00 |
| Age, 25-34 | 2570.00 | 5616.00 | 12919.00 |
| Age, 35-44 | 2604.00 | 7515.00 | 16852.00 |
| Age, 45-54 | 2956.00 | 9697.00 | 20422.00 |
| Age, 55-64 | 2190.00 | 7077.00 | 14482.00 |
| Age, 65+ | 2653.00 | 8334.00 | 16231.00 |
| Marital Status, Population 15+, Total | 14881.00 | 44521.00 | 95077.00 |
| Never married | 4776.00 | 14113.00 | 31191.00 |
| Married | 7002.00 | 22748.00 | 47813.00 |
| Widowed | 1153.00 | 3261.00 | 6088.00 |
| Divorced / Separated | 1950.00 | 4399.00 | 9985.00 |
| Estimated Total Population | 16355.00 | 54235.00 | 117116.00 |
| Estimated Age, 0-4 | 899.00 | 3068.00 | 6837.00 |
| Estimated Age, 5-17 | 2407.00 | 8331.00 | 18074.00 |
| Estimated Age, 5-9 | 1079.00 | 3639.00 | 8017.00 |
| Estimated Age, 10-14 | 1095.00 | 3785.00 | 8157.00 |
| Estimated Age, 15-19 | 1057.00 | 3867.00 | 8277.00 |
| Estimated Age, 20-24 | 1002.00 | 3654.00 | 7848.00 |
| Estimated Age, 25-34 | 1693.00 | 5917.00 | 13285.00 |
| Estimated Age, 35-44 | 1811.00 | 5708.00 | 12962.00 |
| Estimated Age, 45-54 | 2350.00 | 7412.00 | 16164.00 |
| Estimated Age, 55-64 | 2265.00 | 7310.00 | 15475.00 |
| Estimated Age, 65+ | 3104.00 | 9875.00 | 20094.00 |
| Projected Total Estimatedd Population | 15923.00 | 53045.00 | 114645.00 |
| Projected Population 0-4 | 975.00 | 3405.00 | 7583.00 |
| Projected Pop age 6-17 | 2291.00 | 7830.00 | 17290.00 |
| Projected Population 5-9 | 1041.00 | 3562.00 | 7981.00 |
| Projected Population 10-14 | 1023.00 | 3459.00 | 7603.00 |
| Projected Population 15-19 | 1028.00 | 3557.00 | 7717.00 |
| Projected Population 20-24 | 1004.00 | 3550.00 | 7590.00 |
| Projected Age, 25-34 | 1789.00 | 6365.00 | 13809.00 |
| Projected Age, 35-44 | 1640.00 | 5446.00 | 12233.00 |
| Projected Age, 45-54 | 1965.00 | 6214.00 | 13681.00 |
| Projected Age, 55-64 | 2143.00 | 6875.00 | 14687.00 |
| Projected Age, 65+ | 3315.00 | 10612.00 | 21761.00 |
| Race | 18395.00 | 55401.00 | 119162.00 |
| White | 12314.00 | 36140.00 | 73844.00 |
| Black or African American | 2620.00 | 10128.00 | 27781.00 |
| Native American & Alaskan | 0.00 | 147.00 | 231.00 |
| Asian | 2148.00 | 4971.00 | 10018.00 |
| Hawaiian and Pacific Islander | 158.00 | 158.00 | 158.00 |
| Some other race | 904.00 | 2712.00 | 5003.00 |
| Two or more races | 251.00 | 1145.00 | 2127.00 |
| Estimated White | 11930.00 | 38418.00 | 76365.00 |
| Estimated Black or African American | 2355.00 | 9626.00 | 28127.00 |
| Estimated Native American & Alaskan | 0.00 | 4.00 | 23.00 |
| Estimated Asian | 1583.00 | 4189.00 | 7627.00 |
| Estimated Hawaiian & Pacific Islander | 0.00 | 0.00 | 0.00 |
| Estimated 2 or more races | 487.00 | 1998.00 | 4974.00 |
| Estimated Hispanic or Latino | 1631.00 | 5190.00 | 12551.00 |
| Estimated White non-Hispanic | 9945.00 | 32320.00 | 63432.00 |
| Projected White | 11605.00 | 37473.00 | 74472.00 |
| Projected Black or African American | 2326.00 | 9559.00 | 27800.00 |
| Projected Native American & Alaskan | 0.00 | 4.00 | 27.00 |
| Projected Asian | 1528.00 | 4008.00 | 7186.00 |
| Projected Hawaiian & Pacific Islander | 0.00 | 0.00 | 0.00 |
| Projected 2 or more races | 464.00 | 2001.00 | 5160.00 |
| Projected Hispanic or Latino | 1899.00 | 6174.00 | 14892.00 |
| Projected White non-Hispanic | 9546.00 | 31068.00 | 60914.00 |
| Estimated Total Population in Group Quarters | 171.00 | 193.00 | 506.00 |
| Estimated Total Households | 6200.00 | 19684.00 | 42044.00 |
| Estimated Average HH Size | 2.61 | 2.75 | 2.78 |
| Estimated One Person Households | 1621.00 | 4525.00 | 9518.00 |
| Projected Total Population in Group Quarters | 163.00 | 185.00 | 488.00 |
| Projected Total Households | 6035.00 | 19224.00 | 41102.00 |
| Projected Average HH Size | 2.62 | 2.76 | 2.78 |
| Projected One Person Households | 1573.00 | 4397.00 | 9263.00 |
| Estimated Total Families | 4280.00 | 14357.00 | 30626.00 |
| Projected Total Families | 4170.00 | 14046.00 | 29981.00 |
| Families w Children under 18 by Parents' Employment | 2212.00 | 6970.00 | 15564.00 |
| Both parents in labor force | 1269.00 | 4025.00 | 8720.00 |
| 1 parent in labor force | 903.00 | 2637.00 | 6238.00 |
| No parent in labor force | 31.00 | 288.00 | 519.00 |
| Occupation, Employed population 16+ | 9211.00 | 26703.00 | 58037.00 |
| Management and Business Administration | 4832.00 | 13813.00 | 28873.00 |
| Educational, Legal, and Community Services | 1459.00 | 4361.00 | 9008.00 |
| Art, Entertainment, Sports, Media | 319.00 | 1080.00 | 2076.00 |
| Technical and Support occupations | 1988.00 | 5294.00 | 11784.00 |
| Protective & community services | 259.00 | 708.00 | 1290.00 |
| Food preparation | 402.00 | 811.00 | 1905.00 |
| Grounds cleaning/maintenance/laborers | 123.00 | 494.00 | 1208.00 |
| Personal care/service | 255.00 | 815.00 | 1748.00 |
| Sales and related occupations | 909.00 | 3103.00 | 6635.00 |
| Office and admin support | 1127.00 | 3240.00 | 7721.00 |
| Farming, fishing & forestry | 0.00 | 0.00 | 27.00 |
| Construction/extraction & repair occup. | 261.00 | 772.00 | 1798.00 |
| Production occupations | 227.00 | 916.00 | 1617.00 |
| Material moving workers & transportation | 137.00 | 324.00 | 625.00 |
| Employment by Industry: Population 16+ | 9211.00 | 26703.00 | 58037.00 |
| Farming, forestry, fishing, hunting, mining | 0.00 | 0.00 | 27.00 |
| Construction | 373.00 | 857.00 | 2118.00 |
| Manufacturing | 693.00 | 2052.00 | 4787.00 |
| Wholesale trade | 375.00 | 797.00 | 1703.00 |
| Retail trade | 764.00 | 2533.00 | 5382.00 |
| Transport, warehousing, utilities, wastes | 424.00 | 1122.00 | 2885.00 |
| Information Services | 403.00 | 1141.00 | 2251.00 |
| Financial, insurance, real estate, rental | 997.00 | 3462.00 | 6806.00 |
| Management of companies | 0.00 | 0.00 | 25.00 |
| Educational services | 1056.00 | 2989.00 | 6104.00 |
| Health care and social assistance | 1340.00 | 3584.00 | 8664.00 |
| Arts, accommodation, entertainment, rec. | 614.00 | 1632.00 | 3423.00 |
| Professional and other services | 1249.00 | 3407.00 | 6658.00 |
| Public administration | 316.00 | 1229.00 | 2700.00 |
| Class of Worker, Population 16+ | 9211.00 | 26703.00 | 58037.00 |
| Wage & salary workers, private | 6732.00 | 18713.00 | 41330.00 |
| Self-employed workers | 734.00 | 2583.00 | 5617.00 |
| Non-profit wage and salary workers | 544.00 | 2117.00 | 4712.00 |
| Local government workers | 926.00 | 2454.00 | 4719.00 |
| State government workers | 385.00 | 1310.00 | 2696.00 |
| Federal government workers | 207.00 | 577.00 | 1398.00 |
| Unpaid family workers | 31.00 | 56.00 | 109.00 |
| High school graduate | 2960.00 | 8416.00 | 17272.00 |
| Some college | 1887.00 | 5830.00 | 13069.00 |
| Associate degree | 694.00 | 1649.00 | 4547.00 |
| Bachelor degree | 3817.00 | 10763.00 | 21907.00 |
| Graduate or professional | 2533.00 | 8342.00 | 17122.00 |
| Sex by Educational Attainment, Pop 25+ | 12973.00 | 38239.00 | 80906.00 |
| Males less than 9th grade | 171.00 | 580.00 | 1653.00 |
| Males 9th to 12th grade, no diploma | 294.00 | 814.00 | 1409.00 |
| Males high school graduate | 1471.00 | 3722.00 | 7764.00 |
| Males some college | 1029.00 | 3119.00 | 6583.00 |
| Males associate degree | 186.00 | 614.00 | 1683.00 |
| Males bachelor degree | 1647.00 | 4821.00 | 10013.00 |
| Males graduate or professional | 1242.00 | 4163.00 | 8433.00 |
| Females less than 9th grade | 320.00 | 1092.00 | 2105.00 |
| Females 9th to 12th grade, no diploma | 297.00 | 753.00 | 1822.00 |
| Females high school graduate | 1489.00 | 4694.00 | 9508.00 |
| Females some college | 858.00 | 2711.00 | 6486.00 |
| Females associate degree | 508.00 | 1035.00 | 2864.00 |
| Females bachelor degree | 2170.00 | 5942.00 | 11894.00 |
| Females graduate or professional | 1291.00 | 4179.00 | 8689.00 |
| Veteran Population by Sex and Age (18+) | 14102.00 | 41946.00 | 89654.00 |
| Male veterans: 18 to 64 | 344.00 | 817.00 | 1904.00 |
| Female veterans: 18 to 64 | 27.00 | 62.00 | 240.00 |
| Males veteran: 65 and over | 404.00 | 1223.00 | 2710.00 |
| Females veteran: 65 and over | 24.00 | 39.00 | 83.00 |
| Household Income | 6868.00 | 20240.00 | 42809.00 |
| Less than $10,000 | 170.00 | 955.00 | 1670.00 |
| $10,000 to $14,999 | 163.00 | 535.00 | 1045.00 |
| $15,000 to $19,999 | 137.00 | 446.00 | 1235.00 |
| $20,000 to $24,999 | 131.00 | 551.00 | 1460.00 |
| $25,000 to $29,999 | 278.00 | 705.00 | 1185.00 |
| $30,000 to $34,999 | 169.00 | 471.00 | 1198.00 |
| $35,000 to $39,999 | 251.00 | 408.00 | 996.00 |
| $40,000 to $44,999 | 337.00 | 789.00 | 1492.00 |
| $45,000 to $49,999 | 136.00 | 508.00 | 1112.00 |
| $50,000 to $59,999 | 444.00 | 1252.00 | 2971.00 |
| $60,000 to $74,999 | 656.00 | 1824.00 | 3704.00 |
| $75,000 to $99,999 | 863.00 | 2511.00 | 5166.00 |
| $100,000 to $124,999 | 829.00 | 2100.00 | 4565.00 |
| $125,000 to $149,999 | 771.00 | 1749.00 | 3554.00 |
| $150,000 to $199.999 | 767.00 | 2043.00 | 4281.00 |
| $200,000 or more | 766.00 | 3393.00 | 7175.00 |
| Median HH Income | 95367.30 | 104711.82 | 106730.08 |
| Aggregate HH Income | 752794700.00 | 2738050400.00 | 5732923000.00 |
| Median HH Income (White) | 98384.94 | 118191.93 | 123162.63 |
| Median HH Income (Black) | 63201.73 | 66244.16 | 68612.53 |
| Median HH Income (Native American) | |||
| Median HH Income (Asian) | 106124.65 | 98652.92 | 91575.23 |
| Median HH Income (Pacific Islander) | |||
| Median HH Income (Other) | 41831.29 | 26567.82 | 27579.83 |
| Median HH Income (2+ Races) | 16292.02 | 8770.27 | |
| Median HH Income (Hispanic) | 54312.45 | 58411.29 | 54240.67 |
| Median HH Income (Non-Hispanic White) | 96734.54 | 119863.65 | 127921.00 |
| HHs with wage or salary income | 5640.00 | 15809.00 | 34386.00 |
| HHs with self-employment income | 643.00 | 2120.00 | 4502.00 |
| HHs with interest, dividends, rent income | 1993.00 | 6845.00 | 13698.00 |
| HHs with social & supplement. security inc | 1958.00 | 5729.00 | 11289.00 |
| HHs with supplemental security income (SSI) | 106.00 | 474.00 | 1058.00 |
| HHs with public assistance income | 91.00 | 313.00 | 595.00 |
| HHs with retirement income | 1212.00 | 3193.00 | 6324.00 |
| HHs with other types of income | 784.00 | 2293.00 | 5344.00 |
| Median Nonfamily Income | 53900.30 | 50824.15 | 54656.72 |
| Per Capita Income in 1999 | 42047.59 | 50476.45 | 49189.25 |
| Median earnings males | 63962.54 | 78416.82 | 75468.40 |
| Median earnings females | 43723.07 | 44819.76 | 44073.57 |
| Family Income | 402.08 | 376.64 | 350.29 |
| Less than $10,000 | 68.00 | 449.00 | 731.00 |
| $10,000 to $14,999 | 14.00 | 82.00 | 406.00 |
| $15,000 to $19,999 | 24.00 | 112.00 | 476.00 |
| $20,000 to $24,999 | 37.00 | 224.00 | 842.00 |
| $25,000 to $29,999 | 110.00 | 280.00 | 557.00 |
| $30,000 to $34,999 | 61.00 | 258.00 | 712.00 |
| $35,000 to $39,999 | 126.00 | 245.00 | 612.00 |
| $40,000 to $44,999 | 146.00 | 437.00 | 909.00 |
| $45,000 to $49,999 | 121.00 | 384.00 | 736.00 |
| $50,000 to $59,999 | 300.00 | 881.00 | 1942.00 |
| $60,000 to $74,999 | 400.00 | 1161.00 | 2371.00 |
| $75,000 to $99,999 | 621.00 | 1904.00 | 3719.00 |
| $100,000 to $124,999 | 591.00 | 1700.00 | 3770.00 |
| $125,000 to $149,999 | 589.00 | 1463.00 | 3029.00 |
| $150,000 to $199,999 | 638.00 | 1707.00 | 3676.00 |
| $200,000 or more | 676.00 | 3132.00 | 6533.00 |
| Median Family Income | 113169.06 | 124155.33 | 123554.36 |
| Estimated income under $10,000 | 171.00 | 437.00 | 1049.00 |
| Estimated income $10,000-$14,999 | 88.00 | 354.00 | 719.00 |
| Estimated income $15,000-$19,999 | 157.00 | 548.00 | 1197.00 |
| Estimated income $20,000-$24,999 | 132.00 | 595.00 | 1231.00 |
| Estimated income $25,000-$29,999 | 253.00 | 660.00 | 1318.00 |
| Estimated income $30,000-$34,999 | 235.00 | 604.00 | 1424.00 |
| Estimated income $35,000-$39,999 | 244.00 | 549.00 | 1372.00 |
| Estimated income $40,000-$44,999 | 172.00 | 667.00 | 1449.00 |
| Estimated income $45,000-$49,999 | 329.00 | 757.00 | 1388.00 |
| Estimated income $50,000-$59,999 | 306.00 | 1129.00 | 2554.00 |
| Estimated income $60,000-$74,999 | 810.00 | 2237.00 | 4268.00 |
| Estimated income $75,000-$99,999 | 848.00 | 2513.00 | 5786.00 |
| Estimated income $100,000-$124,999 | 763.00 | 2280.00 | 4858.00 |
| Estimated income $125,000-$149,999 | 499.00 | 1475.00 | 3071.00 |
| Estimated income $150,000-$199,999 | 579.00 | 1903.00 | 3962.00 |
| Estimated income $200,000+ | 614.00 | 2976.00 | 6398.00 |
| Estimated Median HH income | 87457.24 | 99553.90 | 102953.39 |
| Estimated Aggregate HH Income | 608245277.00 | 2101535700.00 | 4489020562.00 |
| Estimated Average HH Income | 98104.06 | 106763.69 | 106769.64 |
| Estimated Per Capita Income | 37190.11 | 38748.71 | 38329.74 |
| Projected income under $10,000 | 165.00 | 424.00 | 1018.00 |
| Projected income $10,000-$14,999 | 87.00 | 348.00 | 711.00 |
| Projected income $15,000-$19,999 | 153.00 | 536.00 | 1171.00 |
| Projected income $20,000-$24,999 | 128.00 | 580.00 | 1200.00 |
| Projected income $25,000-$29,999 | 244.00 | 642.00 | 1290.00 |
| Projected income $30,000-$34,999 | 230.00 | 583.00 | 1382.00 |
| Projected income $35,000-$39,999 | 237.00 | 539.00 | 1347.00 |
| Projected income $40,000-$44,999 | 167.00 | 652.00 | 1423.00 |
| Projected income $45,000-$49,999 | 319.00 | 738.00 | 1356.00 |
| Projected income $50,000-$59,999 | 300.00 | 1111.00 | 2510.00 |
| Projected income $60,000-$74,999 | 788.00 | 2176.00 | 4181.00 |
| Projected income $75,000-$99,999 | 822.00 | 2448.00 | 5661.00 |
| Projected income $100,000-$124,999 | 739.00 | 2214.00 | 4739.00 |
| Projected income $125,000-$149,999 | 489.00 | 1446.00 | 3001.00 |
| Projected income $150,000-$199,999 | 564.00 | 1859.00 | 3871.00 |
| Projected income $200,000+ | 603.00 | 2928.00 | 6241.00 |
| Projected Median HH income | 87700.13 | 98621.83 | 104058.12 |
| Projected Aggregate HH Income | 592082611.00 | 2098404189.00 | 4428085463.00 |
| Projected Average HH Income | 98108.21 | 109155.43 | 107734.08 |
| Projected Per Capita Income | 37184.16 | 39558.99 | 38624.32 |
| Total Housing Units | 7103.00 | 21156.00 | 44977.00 |
| Occupied Housing: Owner Occupied | 4241.00 | 14631.00 | 30448.00 |
| Occupied Housing: Renter Occupied | 2627.00 | 5609.00 | 12361.00 |
| Vacant Housing Units | 235.00 | 916.00 | 2168.00 |
| Household Size: Total Occup. Housing | 6868.00 | 20240.00 | 42809.00 |
| 1 person Households | 1984.00 | 5003.00 | 10321.00 |
| 2 person Households | 1910.00 | 6104.00 | 12347.00 |
| 3 person Households | 1317.00 | 3753.00 | 8317.00 |
| 4 person Households | 1065.00 | 3551.00 | 7781.00 |
| 5+ person Households | 592.00 | 1829.00 | 4043.00 |
| Units in Structure | 7103.00 | 21156.00 | 44977.00 |
| Units in Structure: 1, detached | 4120.00 | 13802.00 | 28261.00 |
| Units in Structure: 1, attached | 247.00 | 926.00 | 2298.00 |
| Units in Structure: 2-4 | 1327.00 | 3494.00 | 7983.00 |
| Units in Structure: 5-19 | 693.00 | 1277.00 | 2639.00 |
| Units in Structure: 20 or more | 716.00 | 1531.00 | 3670.00 |
| Mobile Home, Boat, RV, Van, Other | 0.00 | 126.00 | 126.00 |
| Year Structure Built: Total Housing | 7103.00 | 21156.00 | 44977.00 |
| Year Structure Built: 2010 or later | 0.00 | 17.00 | 25.00 |
| Year Structure Built: 2000-2009 | 535.00 | 1113.00 | 2053.00 |
| Year Structure Built: 1990-1999 | 202.00 | 841.00 | 2056.00 |
| Year Structure Built: 1980-1989 | 337.00 | 835.00 | 2389.00 |
| Year Structure Built: 1970-1979 | 342.00 | 1322.00 | 3381.00 |
| Year Structure Built: 1960-1969 | 900.00 | 2765.00 | 5477.00 |
| Year Structure Built: 1950-1959 | 1775.00 | 5687.00 | 10341.00 |
| Year Structure Built: 1940-1949 | 907.00 | 2573.00 | 5964.00 |
| Year Structure Built: 1939 or earlier | 2105.00 | 6003.00 | 13291.00 |
| Median Year Built | 1951.28 | 1952.71 | 1952.53 |
| Total Bedrooms | 7103.00 | 21156.00 | 44977.00 |
| Total Bedrooms: no Bedroom | 173.00 | 552.00 | 1159.00 |
| Total Bedrooms: 1 | 1330.00 | 2809.00 | 5481.00 |
| Total Bedrooms: 2 | 1644.00 | 4121.00 | 9826.00 |
| Total Bedrooms: 3 | 2589.00 | 7996.00 | 16127.00 |
| Total Bedrooms: 4+ | 1367.00 | 5678.00 | 12384.00 |
| House Heating Fuel: Total Occup. Housing | 6868.00 | 20240.00 | 42809.00 |
| Utility Gas | 5592.00 | 16640.00 | 34885.00 |
| Bottle, Tank or LP gas | 63.00 | 192.00 | 579.00 |
| Electricity | 660.00 | 1613.00 | 3234.00 |
| Fuel oil, Kerosene | 499.00 | 1666.00 | 3889.00 |
| Coal or Coke | 0.00 | 0.00 | 0.00 |
| Wood | 0.00 | 7.00 | 16.00 |
| Solar Energy | 0.00 | 12.00 | 12.00 |
| Other Fuel | 7.00 | 49.00 | 117.00 |
| No Fuel Used | 47.00 | 61.00 | 77.00 |
| Lacking Complete Plumbing Facilities | 50.00 | 168.00 | 301.00 |
| Lacking Complete Kitchen Facilities | 54.00 | 294.00 | 720.00 |
| No Telephone Service | 148.00 | 248.00 | 672.00 |
| Value of Specified Owner Occ Housing | 4241.00 | 14631.00 | 30448.00 |
| Under $30,000 | 54.00 | 142.00 | 246.00 |
| $30,000-$59,999 | 66.00 | 173.00 | 264.00 |
| $60,000-$99,999 | 23.00 | 115.00 | 165.00 |
| $100,000-$199,999 | 162.00 | 627.00 | 1497.00 |
| $200,000-$299,999 | 853.00 | 2520.00 | 5246.00 |
| $300,000-499,999 | 1915.00 | 6107.00 | 12811.00 |
| $500,000 and over | 1168.00 | 4947.00 | 10219.00 |
| Median Value, Owner Occupied Housing | 420775.83 | 477855.00 | 477730.03 |
| Aggragate Value, Owner Occupied Housing | 1700585000.00 | 7733952400.00 | 15244430000.00 |
| Median Value of Mobile Homes | |||
| Housing Units with Mortgage | 2933.00 | 10088.00 | 21703.00 |
| Housing Units without Mortgage | 1308.00 | 4543.00 | 8745.00 |
| Mortgage & Costs, Specified Owner | 4241.00 | 14631.00 | 30448.00 |
| With Mortgage: under $500 | 16.00 | 21.00 | 59.00 |
| With Mortgage: $500-$699 | 0.00 | 22.00 | 30.00 |
| With Mortgage: $700-$1,499 | 167.00 | 547.00 | 1042.00 |
| With Mortgage: $1,500-$1,999 | 577.00 | 1397.00 | 2526.00 |
| With Mortgage: $2,000 or more | 2173.00 | 8101.00 | 18046.00 |
| Without Mortgage: under $200 | 30.00 | 67.00 | 88.00 |
| Without Mortgage: $200-$399 | 59.00 | 147.00 | 208.00 |
| Without Mortgage: $400 or more | 1219.00 | 4329.00 | 8449.00 |
| Median Monthly cost as % of HH Inc | 32020.00 | 120248.00 | 273890.00 |
| Median cost as % of HH Inc w/ Mort. | 39802.00 | 140997.00 | 315985.00 |
| Median cost as % of HH Inc w/o Mort. | 12158.00 | 43279.00 | 89947.00 |
| Gross Rent: Renter Occupied Housing | 2627.00 | 5609.00 | 12361.00 |
| Less than $200 | 0.00 | 71.00 | 71.00 |
| $200 to $299 | 0.00 | 55.00 | 85.00 |
| $300 to $499 | 0.00 | 40.00 | 208.00 |
| $500 to $749 | 17.00 | 107.00 | 379.00 |
| $750 to $999 | 188.00 | 376.00 | 1144.00 |
| $1000 or more | 2353.00 | 4704.00 | 10045.00 |
| No Cash Rent | 69.00 | 256.00 | 429.00 |
| Median Gross Rent | 1524.24 | 1425.31 | 1369.66 |
| Median Gross Rent as % of HH Income | 27.79 | 29.76 | 32.03 |
| Inclusion of Utilities in Rent | 2627.00 | 5609.00 | 12361.00 |
| Utilities: Included in Rent | 130.00 | 557.00 | 1091.00 |
| Utilities: Pay extra for 1 or more | 2497.00 | 5052.00 | 11270.00 |
| Estimated Total Housing Units | 7146.00 | 22592.00 | 48403.00 |
| Estimated Owner Occupied | 4170.00 | 15009.00 | 30660.00 |
| Estimated Renter Occupied | 2030.00 | 4675.00 | 11384.00 |
| Estimated Vacant Housing Units | 946.00 | 2908.00 | 6359.00 |
| Projected Total Housing Units | 7365.00 | 23045.00 | 49357.00 |
| Projected Owner Occupied | 4115.00 | 14847.00 | 30220.00 |
| Projected Renter Occupied | 1920.00 | 4377.00 | 10882.00 |
| Projected Vacant Housing Units | 1330.00 | 3821.00 | 8255.00 |
