
Subscribe
Alert Me when new Data Products are available


Last time we talked about income disparity in the US and alluded to the fact that it affects housing prices. So now let’s dig into housing – today we will talk about rental
units next time we will talk about owner occupied units. According to the US Census Bureau’s American Community Survey 2023 there are over 125 million housing units
of which nearly 45 million are renter occupied – that’s 35 percent of American households that live in a rental unit.
West Virginia has the lowest percentage of renters, only a quarter of households live in a rental unit. Whereas in the District of Columbia nearly sixty percent of households rent.
This is followed by New York where over 45 percent of households are renters. So about twice as many households rent in New York or DC as they do in
West Virginia where owning your house is much more common.
In the US the median gross rent, that is, the middle amount paid across all renters, is $1348 a month. This accounts for 30.2 percent of the household's income.
Which is exactly what is advised – financial experts generally recommend spending no more than 30 percent of your gross income on housing (rent or mortgage)
to ensure you have enough left for other essential expenses and savings.
The lowest median gross rent is in West Virginia where it is only $850 - which is just over 29 percent of the median household income.
And the highest median gross rent is in California and is a whopping $1956 a month - which is over 32 percent of the household income.
So, you can see that these tremendous differences in housing costs are offset by differences in income – folks are still generally spending about 30 percent of their income on rent.
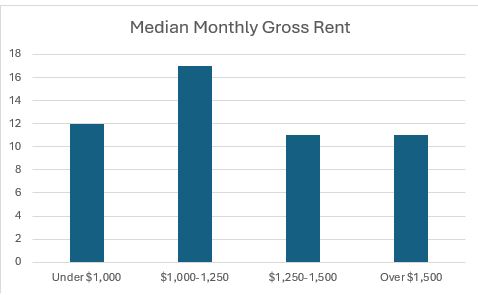
When we look at the gross rent across the states it is a fairly even distribution. There are 12 states with gross rent under one thousand dollars,
the largest group those with gross rent between one thousand and twelve fifty is 17, and then there are 11 in both the twelve fifty to
fifteen hundred and those who pay over fifteen hundred in gross rent.
|
Under $1,000 |
12 |
|
$1,000-1,250 |
17 |
|
$1,250-1,500 |
11 |
|
Over $1,500 |
11 |
North Dakota has the lowest percentage of income being spent on rent, less than 25 percent. This means that folks in North Dakota have more money left
over for other expenses after they’ve paid for housing. Whereas Florida has the highest spending on rent, nearly 35 percent of their income.
In Florida more than half of renters pay more than 30% of their income for rent and 25% pay more than half of their income just to cover rent.
This means that they will feel very house poor – once you’ve covered rent there just isn’t much left for anything else.
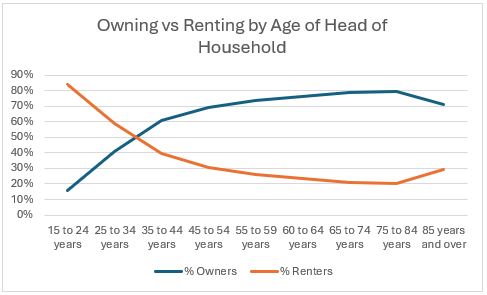
Renting changes over time.
When people are younger, they need to rent to build up income and savings. Thus, only 16 percent of households aged 15 to 24 own their house
and almost everyone rents. Over time more and more households start buying and fewer and fewer households keep renting.
Even at the age of 85 there are still 71 percent of households living in a home they own.
|
Age of Head of Household |
% Owners |
% Renters |
|
15 to 24 years |
16% |
84% |
|
25 to 34 years |
41% |
59% |
|
35 to 44 years |
61% |
39% |
|
45 to 54 years |
69% |
31% |
|
55 to 59 years |
74% |
26% |
|
60 to 64 years |
76% |
24% |
|
65 to 74 years |
79% |
21% |
|
75 to 84 years |
80% |
20% |
|
85 years and over |
71% |
29% |
It’s easy to run data reports about income, educational attainment, family structure, households and hundreds of
other variables with GeoLytics demographic data products – like our American Community Survey or our Estimates and Projections.