
Subscribe
Alert Me when new Data Products are available


↓ Features
↓ Comparison Table
↓ Methodology
↓ Profiles
↓ Reports
Spectrum Marketing Segmentation allows you to perform the many profiling aspects needed to create a comprehensive sense of your marketplace as well as analyze your customers.
What we find is that people tend to live near people "like themselves". So we need to figure out where these clusters of like-minded people live.
The Spectrum interface allows the user to answer four different sorts of questions:
The "kinds of people" are technically called "sociological profiles" or just profiles. These groupings of households that share certain sociological traits and create sub-cultures share common characteristics (such as age, income, race, household structure, education, etc). In order to expand your market you need to know who your customers are and then where to find more people just like them.
Spectrum Market Segmentation includes the ability to:
| Basic | Premium 3M Geocoding | Premium Unlimited Geocoding | |
|---|---|---|---|
| State Single User | $1,495.00 | $2,495.00 | $3,395.00 |
| National User | $2,495.00 | $4,995.00 | $7,995.00 |
Regardless of which type of report you want to run first there are two key terms that you need to understand.
The first is Household Number - this does not refer to how many households are in a given geography but rather how many of the households qualify for that specific segmentation definition. The other way to think of this is that it is showing you the market size for that segment in that given geography. So if there are 300 households but only124 meet the definition for a given segment then the Household Number is 124, not 300. And for each of the segments in that given geography they will have a number that will be between 0 and 300. If you are looking at an Urban area then all of the Rural and Suburban defined segments will rank very low. And the sum of the Urban segments should sum close to 300 (there may be some double counting or some households that are not covered so it will not be exactly 300).
Rank - this is a way of knowing how well a segment matches your geography. The rank is a number between 0-100. So for example when looking at the block groups for Middlesex County, NJ (our office location) there are 584 block groups which each had a number of households in them, and for each there was some percentage that met the segmentation selected (in this case P14 - families with children living with them).
| AREAKEY - Block Group | P14_NAT_RNK | P14_COUNT |
| 340230015031 | 82.9 | 1487 |
| 340230071032 | 56.3 | 911 |
| 340230006062 | 44.1 | 713 |
| 340230027011 | 40.2 | 650 |
| 340230067034 | 39.0 | 631 |
| 340230014131 | 34.8 | 563 |
| 340230065003 | 34.7 | 561 |
| 340230085031 | 33.5 | 541 |
| 340230015043 | 33.0 | 534 |
| 340230014163 | 31.7 | 513 |
The Rank tells you that of all the block groups in the county, if you listed them from largest to smallest the top ranking one gets given a 100 the lowest ranking one gets a zero and then everything else is given a number between 0 and 100. If two block groups have the same number of qualifying households they are given the same rank and treated as a single number even if there are 50 block groups that have that same number. So in fact there will not be 584 individual answers for this county but some significantly smaller number. Further the numbers are skewed to the bottom. There will be many more duplicate numbers in the lower end of the range than at the upper end. For example many block groups may have 0 households that qualify for a given segment but very few will have 1487 households - in fact only one does.
According to the US Census Bureau block groups all break down into two groups: urban and rural. Urban then breaks down into the Urban Cluster (a densely settled area with a population of 2,500-49,999 and the Urbanized Area (a densely settled area with a population of at least 50,000). Similarly Rural breaks down into Farm and Non Farm.
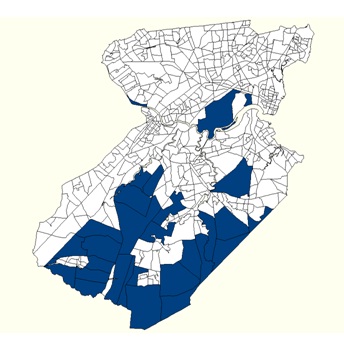
There can be parts of metropolitan and nonmetropolitan areas where there are both urban and rural territory. For example in Middlesex County NJ (where our office is located) most of the area is Urban (white) but there are block groups that are Rural (blue). In fact there are even areas that contain both Urban and Rural counts within a single block group.
Minor Cities are those Urban areas that have a population between 40,000-100,000
Suburban areas are those areas that have Block Groups that are Urban but that are outside of the Urbanized Area.
1. What others do
Other companies create a national set of income criteria - that is to say that a single range is set for the definition of Middle Class or Poor or Upper Middle Class, etc. This is also what the US government does - setting one number for the poverty threshold.
2. Why we wanted to do it differently
We felt that this sort of flat, national number unfairly penalized the less expensive parts of the country and over-counted the more expensive regions.
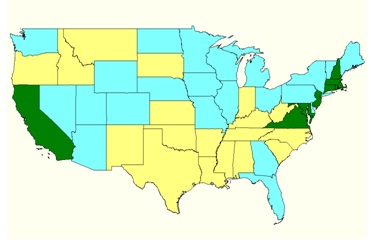
Map Key
Yellow is $45K and below
Light Blue is $45-55K
Green is $55K and above
For example if middle class was defined as a household income of $35-50K it means that you would qualify those who make $32K in Arkansas as lower middle income and someone who makes $50K in California as middle income. But the difference in cost of living is very different for these two areas. For example the average rent in Arkansas is $614.30 a month, whereas in California it is more than twice that at $1335.70. And housing costs are much more extreme if you look at the cost of buying a house. The average house in Arkansas is worth $85,450 whereas in California it is valued at $510,054 - almost 6 times more. So it is not surprising that folks in California need to get paid more just to have equal buying power compared to a dollar in Arkansas. Thus the median household income is 26% higher in California ($58,153) compared to that of Arizona ($46,076).
3. What we did
Instead of using a single, national set of numbers we calibrated every block group up against the median income of the MSA (City including its surrounding suburbs) that it was located in. For those block groups that were not in a city we used the county level median income. This will then better identify where there are households with disposable income - regardless of the actual dollars.
Our reasoning was simple. If you want to know who makes $35-50K, then you can use the Estimates or the census data and you don´t need us to build that for you. But if what you want to know is, where are the richer parts of this town. If the whole area is affluent, then where are the really rich parts of town. If you are trying to market a luxury product then this will give you the real edge. This will allow you to reach those neighborhoods that have more money than their neighboring communities and want to be the early adaptors in new luxury items. It isn´t enough to just mail to areas that make $65K because in California that isn´t really "rich" whereas in Arkansas you could have mailed to folks who are only making $58K because they will feel "richer" than those making $65 in California.
4. Our definitions
Low Income - 25% below regional median
Lower Middle Class - 10% below regional median
Middle Class - regional median
Upper Middle Class - 10% above regional median
Upper Class - 25% below regional median
Affluent - 50% below regional median
30 Largest Metropolitan Areas and their Median Household Income
| Metropolitan Area Name | Total Population | Median Income |
| Pittsburgh, PA | 2,353,358 | 36,847 |
| Tampa-St. Petersburg-Clearwater, FL | 2,764,953 | 36,903 |
| San Antonio, TX | 2,116,370 | 38,904 |
| Miami-Fort Lauderdale-Pompano Beach, FL | 5,585,525 | 40,309 |
| Orlando-Kissimmee, FL | 2,106,938 | 41,598 |
| Riverside-San Bernardino-Ontario, CA | 4,191,837 | 42,208 |
| Cleveland-Elyria-Mentor, OH | 2,086,863 | 43,760 |
| Houston-Sugar Land-baytown, TX | 6,001,502 | 43,967 |
| Phoenix-Mesa-Scottsdale, AZ | 4,465,818 | 44,179 |
| St. Louis, MO-IL | 2,841,384 | 44,405 |
| Cincinnati-Middletown, OH-KY-IN | 2,183,928 | 45,264 |
| Kansas City, MO-KS | 2,095,836 | 45,390 |
| Los Angeles-Long Beach-Santa Ana, CA | 12,959,963 | 45,732 |
| Dallas-Fort Worth-Arlington, TX | 6,593,201 | 46,784 |
| Sacramento-Arden-Arcade-Roseville, CA | 2,152,609 | 47,025 |
| Portland-Vancouver-Beaverton, OR-WA | 2,281,286 | 47,404 |
| San Diego-Carlsbad-San Marcos, CA | 3,093,669 | 47,843 |
| Philadelphia-Camden-Wilmington, PA-NJ-DE-MD | 5,991,927 | 48,509 |
| Detroit-Warren-Livonia, MI | 4,375,369 | 50,108 |
| Denver-Aurora, CO | 2,603,615 | 50,192 |
| Atlanta-Sandy Springs-Marietta, GA | 5,592,147 | 50,910 |
| Baltimore-Towson, MD | 2,702,371 | 51,147 |
| Chicago-Naperville-Joliet, IL-IN-WI | 9,644,791 | 51,318 |
| Seattle-Tacoma-Bellevue, WA | 3,457,586 | 51,704 |
| New York-Nothern New Jersey-Long Island, NY-NJ-PA | 19,147,308 | 51,862 |
| Minneapolis-St. Paul-Bloomington, MN-WI | 3,302,730 | 54,406 |
| Boston-Cambridge-Quincy, MA-NH | 4,628,958 | 54,649 |
| San Francisco-Oakland-Fremont, CA | 4,375,131 | 62,925 |
| Washington-Arlington-Alexandria, DC-VA-MD-WV | 5,550,970 | 63,482 |
The national Median Household Income is $44,552 - but as you can see from comparing this to the chart above of the 30 largest MSAs - this is much higher than some (ie Pittsburgh) and much lower than others (for example DC).
The SPECTRUM segmentations are a way of breaking down the population into groupings that share some common characteristics. These are categorized using several common demographics: income, age, family structure, location, education, race, educational attainment, etc.
Different areas have different types of people. To make matters more complicated one household can belong to multiple profiles. For example the profiles that segment for age and the profiles that deal with what kind of housing stock is in the area are not related. So you can have seniors living in new houses or in historic ones and likewise you can have young, singles living in new houses or historic ones. Some segments however are mutually exclusive; you cannot be both living in a new house and a historic one.
We have built 38 profiles that are based on defining a particular group of people based upon multiple common factors (age, family structure, housing location, income, etc.) In addition we have built single variable definitions so that you could build your own cross-tabulation in the "Find People" component of our Spectrum profiling demographic product.
First, the easy, single variable definitions, broken out by category.
Low Income Neighborhoods - 25% below regional median
Lower Middle Class Neighborhoods - 10% below regional median
Middle Class Neighborhoods - regional median
Upper Middle Class Neighborhoods - 10% above regional median
Upper Class Neighborhoods - 25% below regional median
Affluent Neighborhoods - 50% above regional median
Single, Divorced, Widowed - those with a marital status of single, divorced or widowed
Married with No Kids - those with a family structure of married but do not have kids under the age of 18 currently living with them (they may have non custodial kids or kids over the age of 18)
Married with Kids - those with a family structure of married and living with kids under the age of 18
Family Communities - those whose family structure is either Married with no children, Married with children, or Single Parents
Single Parents - those with a family structure that are unmarried but have kids under the age of 18 currently living with them (they may have a partner/boyfriend/girlfriend - but re unmarried)
Those Over 50 - those over 50 years old
Senior Communities - those over 60 years old
Retirement Communities and Seniors - those over 65 years old and including group homes for the aged
Prisons - those who are in prison
Foreign Born - those who were born abroad
Speak a Foreign Language - those who speak a foreign language as a primary language
Veterans and Military Families - those who currently serve in the armed forces or have served and are now veterans.
Those with Disabilities - those who have someone in the household with a disability (sensory, physical, mental or self-care)
New Homes - those built within the past 10 years
Modern Homes - those built 10-30 years ago
Old, Historic Homes - those prior to 1940
Neighborhoods in Decline - areas that have seen a drop in population from 2000 to 2010
Stable Neighborhoods - areas that have stayed the same from 2000 to 2010
Growth Neighborhoods - areas that have seen an increase in population from 2000 to 2010
Rural - coded by the US Census Bureau´s as rural
Small Town - rural areas that are non-farm and have a higher population density
Minor City - urban areas that have a population between 40,000-100,000
Suburban - this is the area that is outside the urban cluster but is still within the urbanized area
Urban - coded by the US Census Bureau as Urban and located in a place with a population over 100,000
Now the more complicated multi-variable definitions. These will include some but not always all of the following: income, geography, family structure, age, and a few others. These are grouped by geographic location.
Young Singles and Families - both singles and families where the head of household is under the age of 35 and they live in smaller, second tier cities
Smaller City DINKs - those who live in smaller cities and have a double income, no kids
Seniors in Minor Cities - those over 65 who live in minor cities
Young and Poor - those who are at the lowest economic rungs, are under 25, are predominantly single and are living in minor cities.
Young, Poor Families in Minor Cities - those who are at the lower economic rungs and the head of the household is under 35 and they live in a minor city. They may be a couple with or without kids or a single parent.
Older Working Class - lower middle class families where the head of household is older than 60. It is a combination of singles and couples.
Older Second Tier City Dwellers - the head of household is older than 55 and they live in a minor city and are middle class
Young Families in Smaller Cities - the head of household is younger than 35, they are a family (often with kids) and they live in a minor city. They are often middle class.
Young and Single in Smaller Cities- the head of household is younger than 35 and they live in a minor city but they are still unmarried (maybe single, maybe in a relationship)
Pensioners in 2nd Tier Cities - the head of household is older than 65 and they live in a minor city and they are on social security or a pension for financial support
Well Off Families in Smaller Cities - these upper middle income families, often with kids live in smaller cities
Rich Families from Second Tier Cities - these upper income families, often with kids live in smaller cities
Young and Hip Urbanites - these upper income singles and young families (aged up to 35) live in smaller cities
Small Town Older Couples - these lower and middle class couples (aged 65 plus) live in small towns
Working Class Rural Families - these rural families are lower and working class with a middle aged head of the family and they live in rural parts of America
Small Town Young Families - these young families (some couples, some couples with kids and some single parents) are up to aged 44 and are predominantly middle class and live in small towns
Small Town Families - these families (some couples, some couples with kids and some single parents) are aged 25-54 and are predominantly middle class and live in small towns
Rural Large Families - these middle families have lots of kids, are aged 25-54 and live in rural communities
Small Town Older Families - these couples (aged 50-69) live in small towns and are starting to become or have become empty nesters as their kids move out on their own
Wealthy Rural Families - these upper and upper middle class couples mostly have children. They are mainly between 40-55 and live in rural communities
Rural Wealthy Older Couples - these 55+ year olds are (or are becoming) empty nesters and upper or upper middle class and live in rural areas
Wealthy Small Town Families - these high income families are at the top of the income scale for small towns
Working Class Older Suburbanites - these suburbanites are lower middle class, older (aged 55+) and may be single or couples.
Single in the Suburbs - these singles (either never married or divorced) are middle class, younger (up to age 55) and are living in the suburbs
Suburban Widows - these widows (or divorcees) are all ages, middle class and are living in the suburbs
Working Class Single Suburbanites - these suburbanites are divorced, single parents or still single and are lower middle class
Middle Class Suburban Small Families - these couples with kids or single parents have only 1 or at most 2 kids, are middle aged (35-54), middle class and living in suburbia
Middle Class Suburban Families - these couples with kids or single parents are middle class and living in suburbia
Middle Class Empty Nesters - these singles and couples are middle class, over 60 and have no children living at home with them in their suburban home
Middle Class Older Suburbanites - these suburbanites are over the age of 55, singles and couples and are middle class
Middle Class Suburbanites - these singles and couples are middle class and living in the suburbs
Wealthy, Empty Nest Suburbanites - these empty nesters are over 55, are the wealthiest Americans and live comfortably in the suburbs
Suburban Seniors - these singles and couples are over 65, are empty nesters and are living in suburbia
Young Suburbanites - these singles and couples are under the age of 35, may still be single or a couple and are living in suburbia
Black Suburbanites - these suburbanites are African American, many are families with kids though some are singles
Hispanic Suburbanites - these suburbanites are Hispanic, many are families with kids though some are singles
Middle Aged Suburbanites - these singles and couples are between 35-59 and are living in suburbia
Wealthy Young Suburban Families - these 25-34 year olds are couples with kids, singles and couples without kids. They are upper and upper middle class living in the suburbs
Wealthy Middle Aged Suburbanites - these 35-54 year olds are predominantly couples with kids, though there are also some singles and couples without kids. They are upper and upper middle class living in the suburbs
Wealthy Suburban Families - these families (couples with an without kids) are upper income families living in suburbia
Young Suburban Families - these families (couples with an without kids or single parents) are headed by parents under 35, living in suburbia
55+ Middle Class City Dwellers - these older couples, empty nesters (aged 55+) are middle class and live in big cities
The Urban Fringe - this is the area between urban and suburban and the neighborhoods are ethnically mixed, well educated and affluent
Fixed Income Urbanites - these older city dwellers are aged 60+ and are living on fixed income from either Social Security or a pension
Young, Single and Poor in the City - these young people (15-34) are single or single parents, living in the city and are low income
Young and Poor in the City - these young people (15-34) are single, single parents and young couples living in the city and are low income
Urban Middle Class - these middle class singles and couples live in big cities
Young Middle Class City Dwellers - these middle class singles and couples are young (15-35) and live in big cities
Well-educated, Urban Affluent Families - these city dwellers are married with few kids, are affluent and very well educated
Older Upper Middle Class City Dwellers - these middle and upper middle class couples are older (aged 60-74) and live downtown
Urban Intelligentsia - these are young (15-34) singles and couples live around colleges, in mixed neighborhoods with students, professors, those just starting their first jobs after college.
A market potential analysis may include:
Marketing Questions that Segmentation Answers:
There are lots of ways of representing data that make it easier to use and understand. Here are three approaches that are easily run from Spectrum - the pie chart, bar chart and spreadsheet. In all three cases you can see that most people in zip code 08816 are on the upper end of the income scale - breaking into fourths with the bottom two income levels together equally the smallest 1/4 , the next 1/4 is Middle class, and then the top half are upper middle class and upper class - where Upper Class is the largest of the quarters.
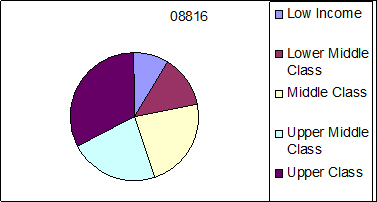
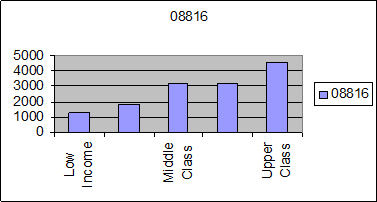
| Zip Code | Low Income | Lower Middle Class | Middle Class | Upper Middle Class | Upper Class |
| 08816 | 1262 | 1833 | 3171 | 3171 | 4610 |
With our Address Profiles component you can determine what kinds of people live near a given address (store location), as well as how many of these sorts of people are there in the immediate vicinity.
For example for our office, 28 Brunswick Woods Drive, East Brunswick NJ 08816 we are told that there are a total of 2401 people who are profiled as follows:
| Profile | Rank | Count |
| Minor City | 42.0 | 2218 |
| Older Second Tier City Dwellers | 26.0 | 66 |
| Modern Homes | 25.4 | 754 |
| Rich families from Second Tier Cities | 25.2 | 67 |
| Speaks a Foreign Language | 24.7 | 729 |
| Foreign Born | 24.1 | 567 |
| Upper Class Neighborhoods | 23.4 | 281 |
| Urban Middle Class | 23.1 | 205 |
| Smaller City DINKs | 21.5 | 38 |
| Well-educated, Urban Affluent Families | 21.3 | 97 |
| Those Over 50 | 21.2 | 381 |
| Affluent Neighborhoods | 20.9 | 281 |
| Middle Class Neighborhoods | 20.7 | 205 |
| The Urban Fringe | 20.3 | 115 |
| Well Off Families in Smaller Cities | 20.0 | 63 |
These profiles are sorted in "Rank order". The rank is a number that tells how well this attribute aligns with the definition. The highest score is a 100 and the lowest is a 0. So a profile with a rank of 20 is significant less indicative of this area as a category whose rank is 42.
Some of these groupings cross each other - for example "Rich families from a Second Tier City" will include those who live in a "Minor City". But there are folks in the minor city who are not rich, so this second count is much lower.Other Profiles are complimentary, for example Upper Class Neighborhoods is 281 people, Middle Class Neighborhoods is 205 so between them they account for nearly 500 people.
One of the basics of launching a new business or opening a new store is that you need to determine whether there is demand for your products/services, that is to say what is your potential market size.
Spectrum Marketing Segmentation helps you figure out the potential economic opportunity available to you in a given geographic market. Whether you sell products or services to consumers, market sizing provides you the basis you need to use resources effectively.
You can also use it to rank or prioritize several potential markets - if you hope to open 5 new stores, which order should they open in, which have the greatest chances of success?
You can also use these numbers - how many potential customers are there to determine market size which in turn will give you potential revenue but it will also allow you to calculate your current market share penetration in a market that you are already fully committed to - how much more potential is there for you to expand in this area?
With the Area Profile you select the geography that you want information about and it will give you a list of all of the profiles for the entire area selected. For example a list of all of the profiles for each of the block groups in a state.
For example if your market was selling to owners of older homes. Then when we look at the number of homes in the zip codes in NJ by age of housing unit (historic, modern, new) we see that Zip code 07001 is a mix of all 3 but none of them strongly. As opposed to zip codes 07002 or 07003 both of which strongly correlate to Old, Historic Homes by rank AND have large Counts for the Historic Homes.
| Zip Code | Old, Historic Homes Rank | Old, Historic Homes Count | Modern Homes Rank | Modern Homes Count | New Homes Rank | New Homes Count |
| 07001 | 10.6 | 367 | 31.6 | 2727 | 14.6 | 566 |
| 07002 | 98.7 | 12335 | 68.6 | 7398 | 9.9 | 386 |
| 07003 | 94.1 | 7751 | 47.6 | 4410 | 31.9 | 1250 |
| 07005 | 52.6 | 1993 | 27.5 | 2339 | 17.4 | 676 |
| 07006 | 56.7 | 2217 | 47.3 | 4380 | 29.5 | 1152 |
Find New Markets for your products. In order to expand your market you need to know who your customers are and what common themes or traits they share.
Spectrum´s Market Segmentation selection My Address List allows you to profile your entire list of customers so that you can determine what your customer base looks like. By segmenting your list by product line you can also differentiate your customers by profiles by product line. For example do your customers for your most expensive product line look the same as those who purchase the mid-range option? Run them as separate lists and see how similar or different they really are.
Most of us have as a largest marketing challenge determining who our customer is and then where to find more people just like them. "My Address List" solves the first part of this question and then "Find People" will solve the other half.
Reasons to Profile YOUR Customers
