
Subscribe
Alert Me when new Data Products are available


About two thirds of American households own the house they live in. For most households this is the biggest investment they will make.
When we look at the median home value we see very different numbers across the country.
First, let’s look at it with an even distribution by states – splitting the 51 states into six brackets each containing either 8 or 9 states.
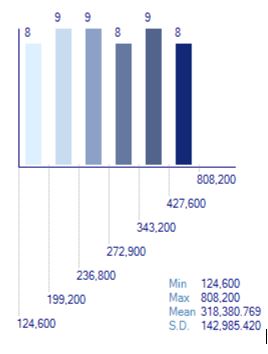
This chart shows that there are 8 states with a median value in the lowest bracket from 124,600 dollars to 199,200 dollars. And we have a nice smooth distribution.
But because there are many more states at the lower end of this scale it means that the top bucket range goes all the way from 427,600 dollars up to 808,200 dollars.
So, the range for the first group 124 to 199 is only 75,000 dollars but at the top end it has a span of 380,000 dollars,
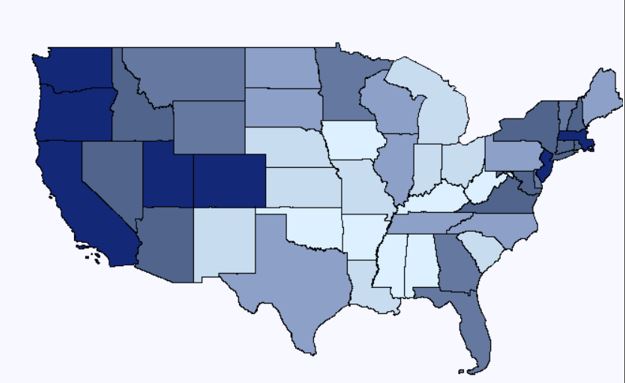
You can see that the higher priced home values are along the two coasts and the middle of the country has the least expensive median home values.
But the colors are very evenly distributed and so you can see that the edges are more expensive but it’s not dramatic.
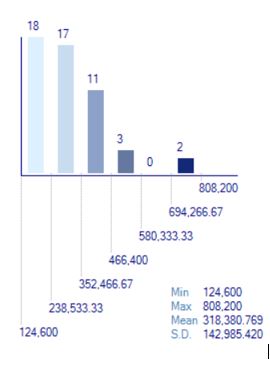
If on the other hand, we decide to divide the states’ median home values into even economic brackets. The picture for the exact same data looks very different.
Here we take the range of a little under 700,000 dollars and divide that into six equal buckets so the first bucket is 124,600 dollars to 238,533 dollars,
a much larger range than the chart up above. When we divide the data this way, we see how very lopsided the distribution becomes.
Now there are 18 states in the lowest bracket of median home values, then 17 in the next bucket, then 11. And only 5 states make it into the top three buckets combined
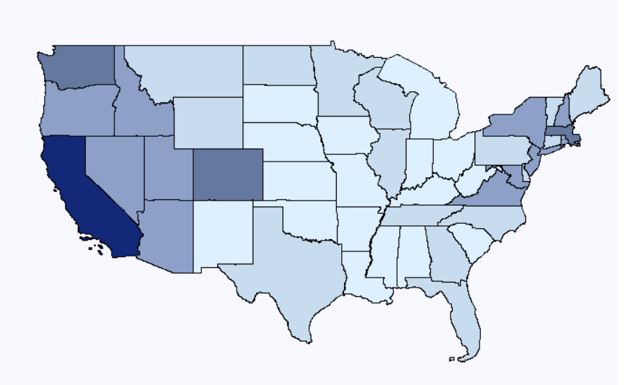
(as opposed to the 46 in the lower three buckets). The only two states in the top bracket are California and Hawaii. And now we can see that the states
with the highest median value for homes are still the west coast but on the east coast it’s really concentrated in the northeastern parts (New England and the Midatlantic).
 |
 |
It’s easy to run data reports about home ownership, educational attainment, income, family structure, households and hundreds of other variables with
GeoLytics demographic data products – like our American Community Survey or our Estimates and Projections.
Next time on “Let’s Explore Data with GeoLytics” we will look at the differences in the types of housing across America.