
Subscribe
Alert Me when new Data Products are available


In America about 2/3 of households live in a single family home. And most of these are detached homes (not row houses which are predominantly found in urban areas).
Idaho has the most households living in single-family detached housing at 74% - meaning 3 of every 4 households live in a single family home.
Whereas in the District of Columbia only 10% live in a detached single family home and another 21% live in attached single family homes (row houses).
Even combined it is about a third live in a single family home the others live in multi-unit buildings. The next lowest state is NY at 41% which is a big jump.
But really, this is the difference between DC which is all an urban area and NY which has several cities but also lots of suburban and rural communities.
Another important predictor for whether or not you live in a single family home is whether you are a home owner or a renter.
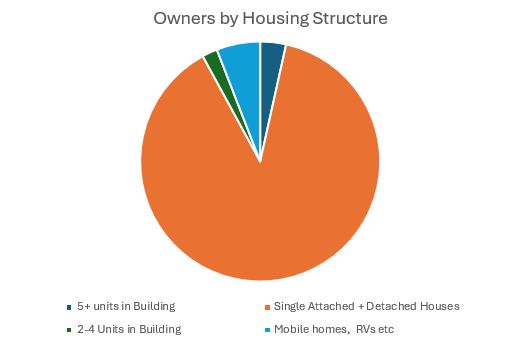
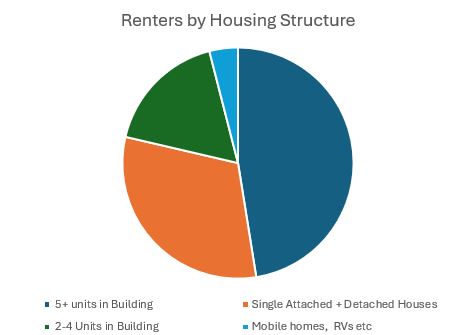
Home owners are much more likely to own a single family home whereas renters are more likely to live in multi-unit buildings.
Nationally almost all home owners (88.6%) live in a single family home, except in DC where only 2/3 of owners live in a single family home.
Twenty percent of households in the US live in a building with 5 or more units, but these are almost all renters.
But for renters, less than 1/3 live in a single family home and nearly half rent a unit in a building with more than 5 units.
Instead of looking at where do owners versus renters live, if we look at who lives in each type of unit we see very quickly that
most single family homes are owned and most multi-unit homes are rented (even very small buildings are mostly rentals).
As a side note, there are also 6.7 million mobile homes that are also predominantly owned.
This accounts for about six percent of households who live in a mobile home.
|
Single Attached + Detached Houses |
2-4 Units in Building |
5+ units in Building |
Mobile home |
|
|
Owners |
75,903,073 |
1,763,823 |
1,835,188 |
4,916,719 |
|
Renters |
14,227,371 |
7,929,171 |
21,668,808 |
1,821,141 |
|
% Owners |
84% |
18% |
8% |
73% |
|
% Renters |
16% |
82% |
92% |
27% |
It’s easy to run data reports about home ownership, educational attainment, income, family structure, households and hundreds
of other variables with GeoLytics demographic data products – like our American Community Survey or our Estimates and Projections.
Next time on “Let’s Explore Data with GeoLytics” we will look at the Household Vacancies across America.