
Subscribe
Alert Me when new Data Products are available


↓ Features
↓ Variables
↓ Geography
↓ Guided tour
CensusCD 1990 Long Form is a unique software package that combines an enormous amount of valuable demographic statistics with the power to easily select, map, and export the data. This one CD-ROM is the easiest-to-use and most complete source for detailed information about the people, housing, and economy of the United States in 1990.
CensusCD 1990 Long Form is an integrated data and software package. Data reports and thematically shaded, color maps are created on the fly from the one CD. You don't have to open multiple programs, import boundaries, or edit files and tables, and you don't have to be an expert in statistics or mapping to use this product.
It includes all of the data, map boundaries, and software you need in one seamless package.
The data provide details about the population and housing of the United States. It has demographic information down to the neighborhood level (block groups) from the 1990 US Census (STF3 A, B, C and D).
The Software on CensusCD 1990 Long Form makes it simple to search and select the data you're interested in. You can custom tailor reports down to the neighborhood level, around a central point, or for several areas at once. You can view, export, or print results as maps, text, or data reports. CensusCD 1990 Long Form lets you create your own computed fields from the data and maps too. You can even export any of the geographic boundaries to other mapping packages.
How Can CensusCD 1990 Long Form Benefit You?
CensusCD 1990 Long Form lets you easily explore, analyze, and visualize an enormous amount of detail about the people, housing, industry, economy, and places in the United States - right from your PC.
The data are used every day by marketing analysts and researchers, media companies, utilities, community planners, health professionals, real estate consultants, business owners, social and political researchers, state and local governments, journalists and librarians. Anyone who needs detailed demographic information will benefit enormously from CensusCD 1990 Long Form and our other census-based products.
If you need answers concerning the demographics of the United States, then CensusCD 1990 Long Form will not only save you both time and money, it will improve the quality of your work and your competitive edge. It is critical data for making choices about site location, consumer marketing plans, social policy, budgeting, and millions of other important decisions. Governments and corporations routinely spend thousands of dollars for this amount of data and the software to make it useful.
While some of this data is available from the Census Bureau and other sources on the Internet, only CensusCD brings it together in a simple package that includes the data as well as thematic mapping. No other demographic product gives you this much value in one package.
CensusCD products make it both affordable and practical to put all the power of census, demographics on your desktop computer and map it.
CensusCD will help you answer questions like these in just a few simple steps...
...What is the average rent in Piqua City, Ohio?
...How do zip codes in New York (city or state) rank by median household income and what does it look like on a color map with red showing the highest levels of income?
...What is an income profile for a certain census tract in Baltimore?
...What does a shaded map for Chicago, Illinois, look like showing population by Hispanic origin for all of the census block groups in the city?
...How many people speak Chinese within a 15.5 -miles radius of Seattle?
...What is the percentage of people with higher education in the block around 15, Broad street, Newark, New Jersey?
...Where do the most people of Japanese origin live in Los Angeles county, California?
...How much time do people in your neighborhood spend on daily commuting?
...And on and on. CensusCD 1990 Long Form provides you with simplicity, value, and flexibility.
| Basic | |
|---|---|
| National User | $500.00 |
| Demographic variables | ✪ >3500 variables |
Over 3,500 demographic variables are available for every area.
Whether you need to know the total population, median income, housing values, or even the percent of houses with indoor plumbing in a given area, CensusCD 1990 Long Form can provide your answers. It contains all of the demographic variables released on the 1990 Census STF-3 files.
CensusCD 1990 Long Form covers over 375,000 locations (zips, block groups, tracts, counties, etc). The Census Bureau organizes the variables into 300 different Tables. We have further grouped these Tables into 14 Groups of demographics to ease with selections. The 14 Groups are broken out into their categories below, but the general overview is as follows:
For example, if you wanted to know how many Female-Headed Households there were in an area you would select: Group = Family Table = "Female no husband, children" and/or "Female no husband, no children"
If you wanted to know the break out between public and private school attendance you would select: Group = Education Table = "In elementary or High School, public school" versus "In elementary or High School, private school"
For a complete list of variables from the 1990 Long Form, Click Here.
16 geographies covering over 375,000 locations
CensusCD gives you over 3,500 demographic variables for 375,000 geographic areas of the United States. These geograhic areas consist of the following levels (numbers indicate how many specific geographies within that level):
Note the following acronyms:
ANRC = Alaskan Native Regional Council
PMSA = Primary Metropolitan Statistical Area
MSA = Metropolitan Statistical Area
CMSA = Consolidated Metropolitan Statistical Area
MCD = Minor Civil Division (townships, boroughs, districts, etc. found in 28 states)
CensusCD + Maps Guided tour will step you through the whole process of how to create data reports and work with maps. Start with "Data" for a look at the different ways you can generate data from either program or start with "Maps" to see the mapping features of CensusCD + Maps.
CensusCD is a powerful yet straightforward and easy to grasp tool.
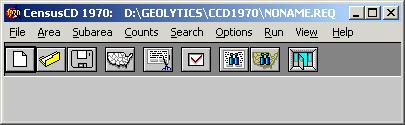
You need to look up information or create a report... OK, just follow these five steps from the main menu:
1. Select Area
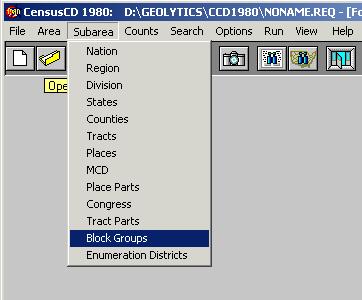
2. Select Subarea
3. Select Counts
4. Select Run
5. Select View
You can select an area, down to block groups.
This is what you do:
Sometimes you want to cover smaller units within a larger unit. You have completed selecting your area, which is this larger unit. Now, go to the Subarea menu to choose the smaller units. Click on the items offered there. Your report will be broken down into these smaller units; one report line for each of them.
CensusCD area selection is flexible. You can define a radius area.
You can select a street in this ZIP and then enter a house number.
System will locate a block group that contains this address.
Once the areas are done, you can select what fields will be in your report. Select counts from the main menu and you'll see census demographics neatly grouped in 15 categories. Click a category button to view the list of tables for
these categories. Click a table to see the list of counts. Click a count to see it appear here and later in your report. A sort function is available as well.
What if you are not sure where your area is? Just click on search menu, enter information and click Find.
You can see all possible variations on the word "boulder" in Colorado
You can search for counts, too. Here we've used education as an example.
Powerful, yet easy to use options, allow you to focus your report on specific tasks and add-on features.
Now that you are all set, you can run your report
See the progress bar moving. This may be especially useful if you are generating a very large report.
The report window is created when the report is done.
You can search, select, copy and print.
The status bar (located on the bottom of the application window) contains our "intelligent advice" messages that guide you every step of the way throuh the report creation process.
Here is an example:

All this and many other things are explained in greater detail in our 25,000 line fully indexed help file.
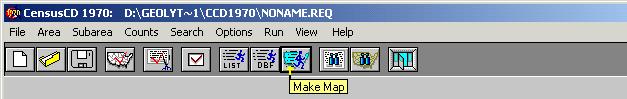
You can also map your report:
The ABC of thematic mapping with CensusCD+Maps is simple. First you create a report.
Let's take Montana as the area and select block groups as our subareas. You need to choose Census counts, too. Let's use Standard, Social characteristics. Now you hit the Run Map button here:
The 899K report wil be created in approximately 10-30 sec and now you see the map (we made it smaller than usual to save your loading time):
What you see is the distribution of the S_TotPop (total population) among Montana block-group using the "Equal counts" groupping algorithm with 5 ranges. It means, all areas were divided into 5 groups according to their values of S_TotPop so that each groups has approximately the same numbers of areas.
Suppose what you really need is to see the percentage of the urban population for Helena area and you want the areas to be sorted out into 5 groups, from 0% to 20%, from 20% to 40% and so on. Click on the S_PctUrb line and see the map repainted. Now switch to the Stat Tab and select the Equal Ranges algorithm. What you see now is a differently colored map, mainly green because the S_PctUrb for the most of Montana block groups is far below the maximum. Now you need to zoom on Helena. Pick the Zoom Plus tool and click on the location several times. What you see is this:
What is this gren tract ID? Click on it using the ?i tool and switch to Area Tab.
Aha. You see the whole block group MT 049 BNA 9792 BG4 highlighted including a water part of it. Where is BG 3, by the way? Right, you simply click on the line above and see...
This style of mapping is simple and intuitive but you can do pretty sophisticated thing, too. Suppose you want to map a characteristics that is not in the report Counts but can be computed from it. Let's assume it is the percentage of high school graduates and college graduates together in the total population. What you need, then, is to compute (S_Colleg + S_HSGrad) / S_TotPop * 100. This is what you can see if you hit the Calculator button:

You see the full list of all the fields in the report and a "keyboard". Just type your formula, give it a name
and press OK. The new virtual column will be added to the list of the report fields.
Click on the new virtual column and you will see it mapped:
... and more!
This is a great tool. Hope you will think so, too.
