
Subscribe
Alert Me when new Data Products are available


↓ Features
↓ Variables
↓ Geography
↓ Guided tour
Finally the detailed demographic data from the 1980 US Census is available in a convenient, easy to use format. GeoLytics has created CensusCD 1980, a single CD-ROM with detailed 1980 population statistics, housing data, and geographic boundaries combined with software for creating reports and displaying data as colorful thematic maps.
CensusCD 1980 provides an important baseline for analyzing present and future trends in census data.
Finally you can find complete 1980 Census data, both the 100% count (STF-1) and long form (STF-3) data, down to the block group level in one convenient source. CensusCD 1980 gives you over 1,500 demographic variables for every Block Group, Tract, Place, Minor Civil Division (MCD), County, State, Division, and Region as well as for the Nation as a whole. Covers 1980 population and housing attributes with data on age, race, ancestry, gender, poverty, income, education, commuting, employment, rent, home ownership, housing value, size of housing, heating systems, and even bathrooms. Users can select one or several data items in customized reports or choose pre-formatted single topic reports with pre-selected data fields. All data can be exported (see below).
CensusCD 1980 includes land and water boundaries for the entire country from the block group level up. Boundaries for 1980 are provided for all Block Groups, Tracts, Places, Minor Civil Divisions (MCD), Counties, States, Divisions, and Regions as there were defined by the Census. GeoLytics built up this boundary coverage from the most detailed level of census geography, the census block. The 1990 Census was the first census in which every part of the country was assigned to a census block with its features defined geographically. GeoLytics created a detailed set of 1980 boundaries by using the relationship of what 1980 tracts these 1990 block assignments were within, as determined by the Census Bureau. This provides an extremely detailed boundary set with a solid historical basis. The CD integrates boundary selection with its thematic mapping tool so users never have to even think about the boundaries when creating a map and viewing data. No desktop mapping or GIS experience is needed to use this product. Boundaries can be exported in popular GIS formats.
CensusCD 1980 includes a Data Mapping Engine which USA TODAY called "Simple But Slick" Users can create customized geographic data selections and visualize the demographics as color shaded maps. This improves the perception of data trends and allows users to quickly find patterns in the data. The Map Viewer has tools for zooming in and out of the map display, hiding water boundaries, showing labels, and even allows customization of themes, colors, and ranges. Shows data information alongside of map display for quick reference or to change theme display on the fly.
Detailed data reports or thematic maps are generated with only three steps. CensusCD 1980 uses an interface similar to GeoLytics' previous products. In describing that interface the Technology Columnist for the Evansville Courier said it, "takes the government information we all need and puts it in a form that a chimp could work with." When combined with the convenience of one disk the product's simple interface eliminates the technological hurdles of working with 1980 US Census data. It is a perfect resource for anyone who needs a recent historical perspective of the United States' population and housing.
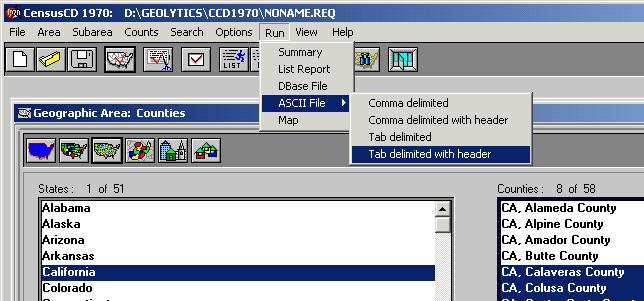
CensusCD 1980 exports data for use with other software such as word processing, spreadsheets, databases, statistical, desktop mapping, and GIS packages. This dramatically increases the flexibility of the data by making it portable and provides considerable cost savings considering all the different formats for export. While this is a standard feature of GeoLytics' products some vendors actually charge more for versions of their products to allow exporting or only provide the data in a single format. Data reports can be created as .DBF or ASCII (comma or tab delimited, with or without headers) files and map boundaries can be exported in popular GIS formats (ArcView GIS's Shapefile or MapInfo's MID/MIF) with the data attributes already linked.
Convenience of a single CD-ROM finally makes it easy for PC users to work with this historical demographic data. This is the first time such a complete set of 1980 Census data has ever been combined onto a single CD -ROM. CensusCD 1980 eliminates the need to download megabytes of data, swap multiple CDs, decompress unnecessary data files onto your hard drive, or in some cases. GeoLytics' unique compression technology decompresses data dynamically, or "on the fly", to quickly get results right from the CD. The CD runs under Windows 95, 98, or NT.
CensusCD 1980 comes complete with all the data and software a user needs for getting results. It is a complete product for visualizing 1980 demographic data down to the tract level. While the CD exports data for use with other more specialized software packages, many users will find all they need to extract, analyze, and produce detailed color maps of the data. The software is simple enough for anyone familiar with Windows to use yet provides sophisticated tools for serious researchers.
CensusCD 1980 makes it easy to select specific geographic areas of interest. Users can include any areas in a geographic level within a single report such as selecting specific tracts or counties in different states within the same report. CensusCD 1980 lets you customize results. If you need information on tracts for a county in Maine and one in California and another in New York, you can have them all in one report. More importantly the program will automatically break down one or more larger areas into component units. For instance getting New New York, Ohio and Pennsylvania reported by tract, place, or county is a snap. Compare this to data vendors who only provide raw data and want to sell you only one state or county at a time.
The Map Viewer includes a calculator for performing mathematical operations on demographic data in the reports to create new variables or show relationships between variables. Automatically maps results as a new data theme. Provides enhanced statistical analysis capability within the product to expand the usefulness of the information. Includes comparative symbols (>,=, <) and logical operators ("and", "or", "not") along with mathematical symbols for more in depth analysis.
Documentation is included directly on the CD. This lets users start creating reports in just minutes with an explanation of the simple interface and examples. A special help section explains controls and features of the Map Viewer to enable users create customized maps. Eliminates the problem of losing user documentation.
| Basic | |
|---|---|
| State User | $495.00 |
| National User | $895.00 |
| Geographic Identifiers | ✪ >1550 variables |
Finally you can find complete 1980 Census data, both the 100% count (STF-1) and long form (STF-3) data, down to the block group level in one convenient source. CensusCD 1980 gives you over 1,500 demographic variables for every Block Group, Tract, Place, Minor Civil Division (MCD), County, State, Division, and Region as well as for the Nation as a whole. Covers 1980 population and housing attributes with data on age, race, ancestry, gender, poverty, income, education, commuting, employment, rent, home ownership, housing value, size of housing, heating systems, and even bathrooms. Users can select one or several data items in customized reports or choose pre-formatted single topic reports with pre-selected data fields. All data can be exported (see below).
CensusCD 1980 Guided tour will lead you through the whole process of creating data reports and working with maps. Start with "Data" for a look at the different ways you can generate data from either program. Start with "Maps" to see the mapping features of CensusCD 1980.
CensusCD 1980 is a powerful yet straightforward and easy to grasp tool.
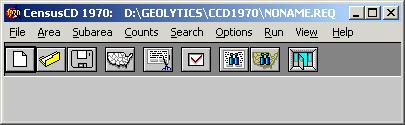
You need to look up information or create a report... OK, just follow these five steps from the main menu:
1. Select Area
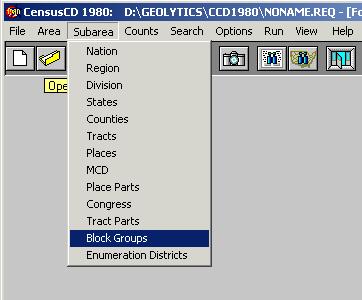
2. Select Subarea
3. Select Counts
4. Select Run
5. Select View
You can select an area from nation down to places.
This is what you do:
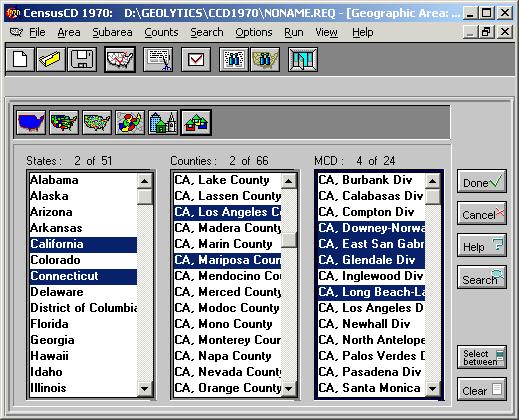
Sometimes you want to cover smaller units within a larger unit. You have completed selecting your area, which is this larger unit. Now, go to the Subarea menu to choose the smaller units. Click on the items offered there. Your report will be broken down into these smaller units; one report line for each of them.
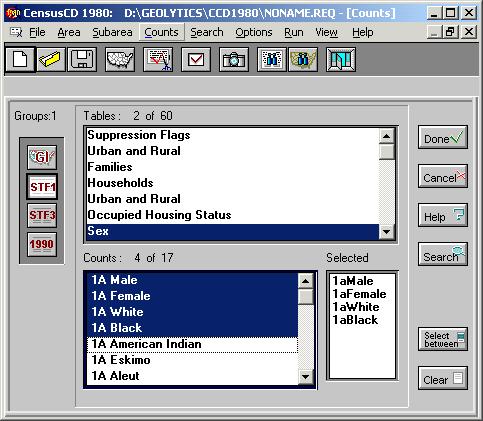
Once the areas are done, you can select what fields will be in your report.Select counts from the main menu and you'll see the census demographics neatly grouped into 3 categories. Click a category button to see lists of tables and counts. Click on and highlight a count to see it appear here and later in your report.
See changes between 1980 and 1990: There is a count selection called “1980-1990 General Counts”. Selecting this will automatically select about 20 demographics from 1980, 20 demo-graphics from 1990, and percentage change demographics. This group of counts can be se-lected for any area and Subarea, except for Congressional districts, Place parts, and Tract parts.
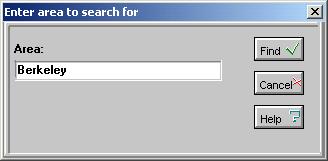
What if you are not sure where your area is? Just click on search menu, enter information and click Find.
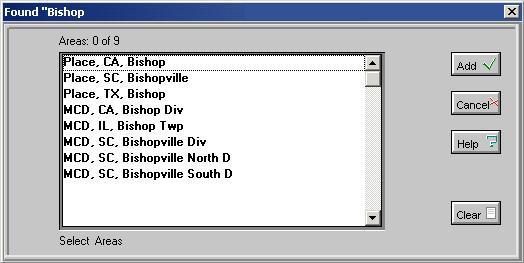
You can see all possible variations on the word "Bishop" in USA
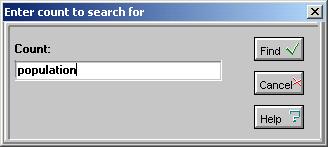
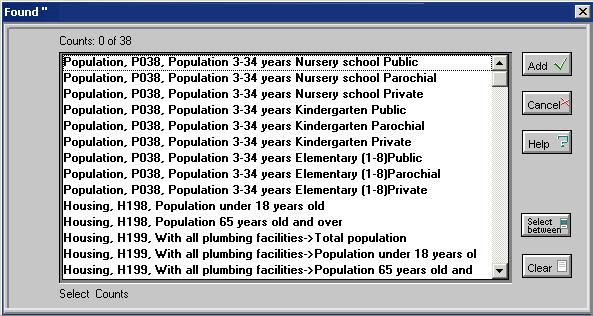
You can search for counts, too. Here we've used population as an example.
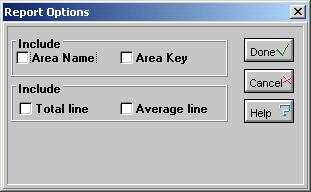
Easy to use options, allow you to focus your report on specific tasks and add-on features.
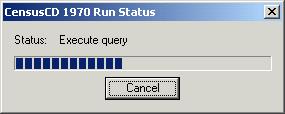
Now that you are all set, you can run your report.
See the progress bar moving. This may be especially useful if you are generating a very large report.
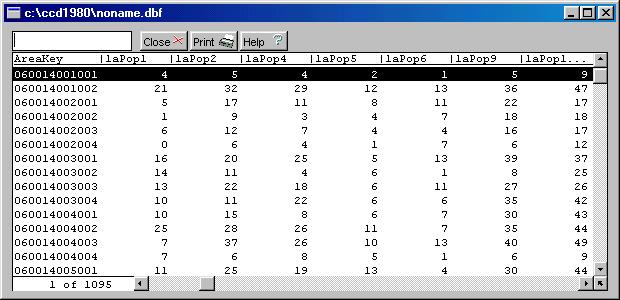
The report window is created when the report is done.
You can search, select, copy and print.
The status bar (located on the bottom of the application window) contains our "intelligent advice" messages that guide you every step of the way throuh the report creation process.
Here is an example:

All this and many other things are explained in greater detail in our fully indexed help file.
You can also map your report:
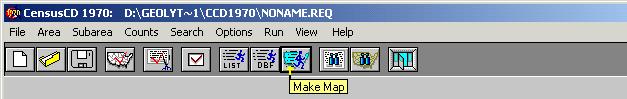
The ABC of thematic mapping with CensusCD 1980 is simple. First you create a report.
Let's take New York County as the area and select Block Groups as our subarea. You also need to choose Census counts. STF1/Sex By Age: 1A Persons Under 1 Year, 1A Persons 1 and 2 yr . . . 1A Persons 85+ yr. Now click the Make Map button:
The 116K report wil be created in a few seconds and now you see the map (we made it smaller than usual to save your loading time):
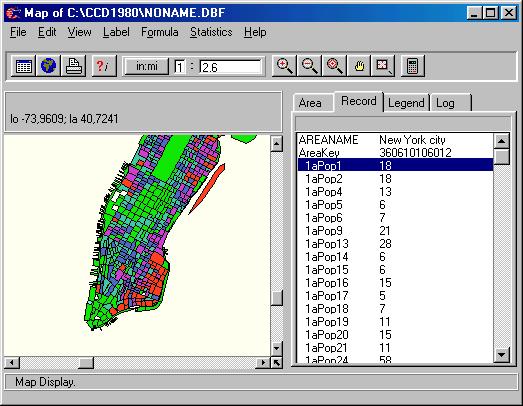
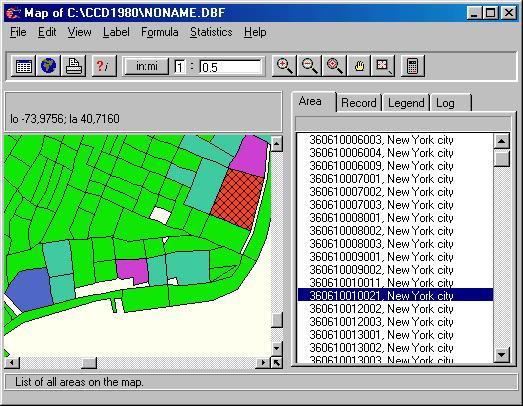
What you see is the distribution of the 1aPop1 (Persons Under 1 Year) among New York city block groups using the "Equal counts" grouping algorithm with 5 ranges. This means that all areas were divided into 5 groups according to their values of 1aPop1 so that each group has approximately the same area.
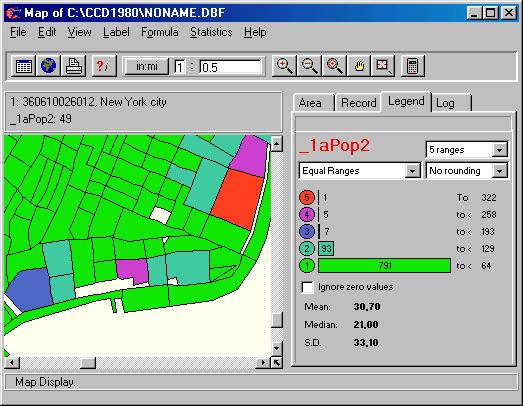
Suppose what you really need is to see the Persons 1 and 2 yr and you want the areas to be sorted out into 5 groups, from AGSE020 from 0% to 20%, 20% to 40% and so on. Click on the 1aPop2 line and see the map repainted. Now switch to the Legend Tab and select the Equal Ranges algorithm. What you see now is a differently map, mainly green because the 1aPop2 for the most of New York City block groups is far below the maximum. To zoom into a block group, click on the Zoom Plus tool and click on the location several times. You will see this:
What is this gren tract ID? Click on it using the ?i tool and switch to Area Tab.
Aha. You see the whole block group 360610010021 highlighted. To find out where 360610012002 is, simply click on the line above and see...
This style of mapping is simple and intuitive but you can also do sophisticated things with it. Suppose you want to map a characteristic that is not in the report Counts but can be computed from it. Let's assume it is the Total Population whose age is < 10 years. What you need, then, is to compute (_1aPop1 + _1aPop2 + _1aPop4 + : + _1aPop9). This can be done by clicking on the Calculator button:
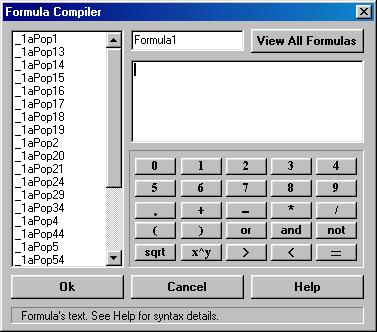
You see the full list of all the fields in the report and a "keyboard". Just type your formula and give it a name.
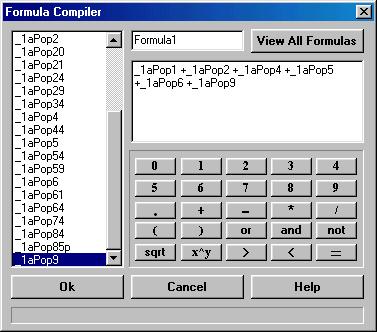
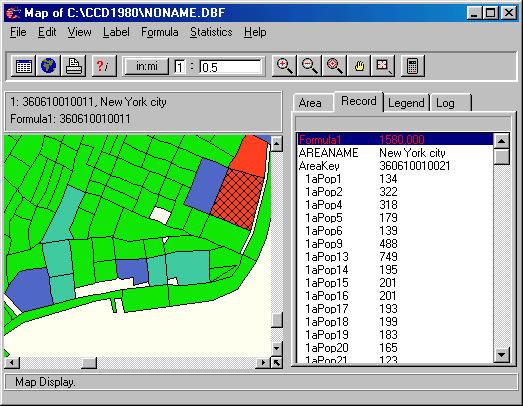
and press OK. The new virtual column will be added to the list of the report fields.
Click on the new virtual column and you will see it mapped:
Of course this is only the ABC of thematic mapping with CensusCD 1980. We have a lot of nice features. Among those are
... and more!
This is a great tool. Hope you will think so, too.
