
Subscribe
Alert Me when new Data Products are available


↓ Features
↓ Variables
↓ Geography
↓ Methodology
Census 1980 in 2010 Boundaries allows users to access US Census data from 1980 and easily compare it with the 2010 Census data. It is the first and only source of Census data from 1980 that is expressed at all of the 2010 Summary File (SF1) geographies (except block). The Census 1980 in 2010 Boundaries contains both the 1980 Long Form (STF-3) and Short Form (STF-1) datasets. It includes detailed demographic data about topics such as population, household structure, income, poverty, education level, employment, housing costs, immigration, and other variables. The "1980 in 2010 Boundaries" is an invaluable resource for policymakers, community organizations, and researchers who want to analyze the changes that have occurred in the U.S. from 1980 to 2010.
Additionally we have made the 1980 data more accessible than in the original CensusCD 1980 – because we have normalized the data to the 2010 boundaries, meaning that the entire country can now be viewed at the Block Group, Tract and zip code level. In the official 1980 census, only urban areas had tracts and block groups. We have also added MSA, CMSA, and PMSA geographies, whose concepts were being formed in the late 1970s and early 1980s but whose geographic boundaries were not yet assigned in the 1980 census.
Why Normalize 1980 Data to 2010 Geographic Boundaries?
Geographic boundaries change from census to census which means if you want to look at the changes in the data from 1980 – 1990 – 2000 – 2010 then you need to deal not only with the demographic changes but also the geographic ones. By and large, county boundaries are stable over time but tracts and block groups regularly change from one census to the next.
In 1980 there is the additional issue of un-tracted areas that needs to be dealt with. The U.S. Census Bureau only tracted those areas that were considered "urban" or part of a metropolitan area. Below is a map of the entire U.S. with the 1980 tracted areas shown. (Map created by GeoLytics’ CensusCD 1980)
US Census Tracts in 1980
The definition of "metropolitan" has also changed in the past 30+ years. Areas that we now see as the suburbs of large cities were still farming communities in 1980. For example, when we look at the current definition of the Fort Wayne MSA (comprised of Adams, Allen, De Kalb, Huntington, Wells, and Whitley counties) one of the counties was not tracted (Whitley) and another (Huntington) was only partially tracted in 1980.
2000 Fort Wayne MSA with 1980 Tracts Boundaries
2010 Fort Wayne MSA with 2010 Tract Boundaries
This means that if we want to see how the current Fort Wayne, IN metropolitan area has changed, we are missing information for these tracts.
CensusCD 1980 in 2010 Boundaries fixes this problem – we have normalized the data to the 2010 tracts – thus the entire country is tracted. Because we have taken the MCD’s and counties and normalized those areas that weren’t already tracted to the tract and block group, it means that we can now look at the 1980 data at the tract level for the entire country.
Why is normalizing data such a big deal?
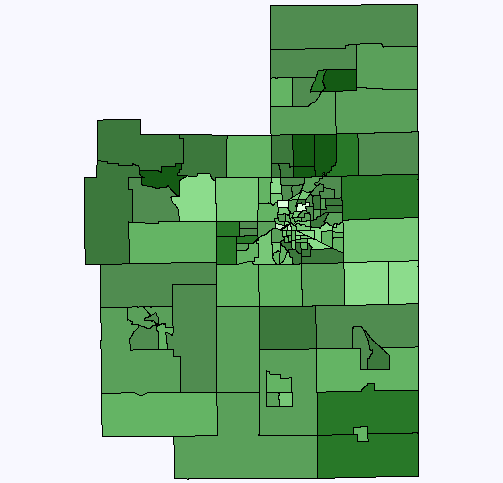
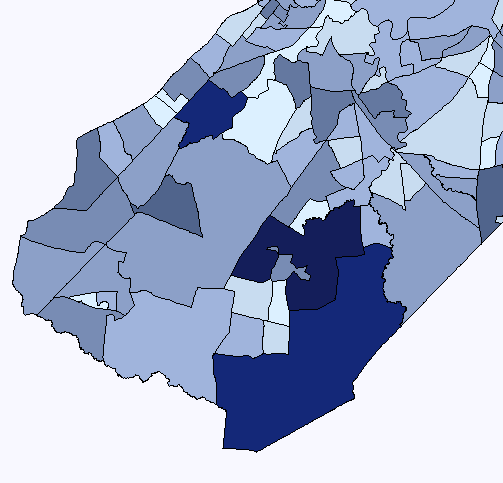
Changing track boundaries mean that it is difficult to compare track data over time. In the example below, a section of Middlesex County, NJ is shown broken-out at the census tract level. At a glance, one can observe that there are changes in the census tracts from 1980 to 2010. In fact, Middlesex County, NJ has a nice example of tracts merging, splitting, and merging/splitting into new parts. Overall, the number of tracts grew from 139 in 1980 to 175 tracts in 2010, a 26% increase.
Subset of Tracts in Middlesex County, NJ in 1980 Boundaries
Subset of Tracts in Allen County, IN in 2000 Boundaries
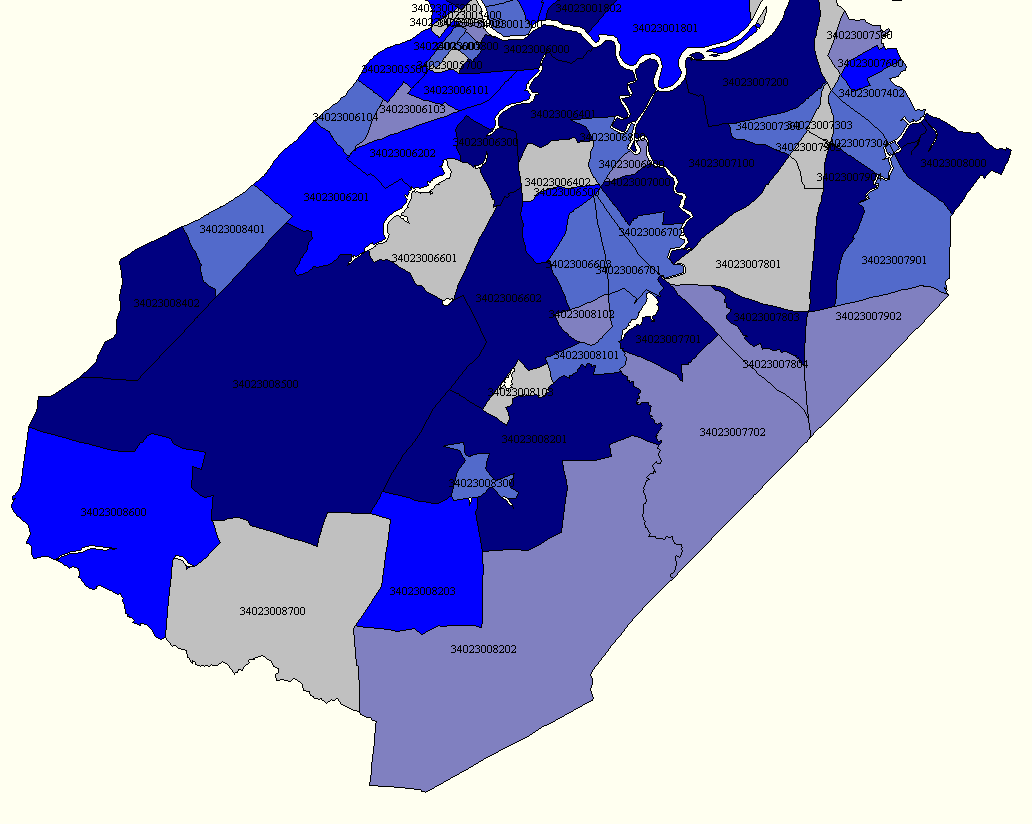
Taking a closer look at Middlesex County from 1980 to 2010 reveals the modifications in tract boundaries that significantly impact how researchers study and account for changes in a population over time. For example, the single 1980 Tract # 008402 broke into two tracts in the 2010 Census. It is a straight-forward 1-to-2 correspondence. As opposed to the tract to its east which split into 4 or the one to the south that split into 5.
There are examples of tracts merging (2-to-1) as the population in an area shrinks. And then the most complicated where multiple tracts merge and then resplinter to form new options (many-to-many). For these reasons, it is so difficult for researchers to contend with the issue of changing geographic boundaries over time.
| Basic | |
|---|---|
| State User | $695.00 |
| National User | $1,295.00 |
| Geographic Identifiers STF1A | ✪ 58 variables |
| Geographic Identifiers STF3A | ✪ 292 variables |
Census 1980 in 2010 Boundaries 🗗 includes both the 100% count (STF-1) and the Long Form (STF-3) data, down to the block group level in one convenient source. Census 1980 in 2010 Boundaries gives you over 1,500 demographic variables for every Block Group, Tract, Place, Zip Code (ZCTA), County, and State, as well as for the Nation as a whole. It covers 1980 population and housing attributes with data on age, race, ancestry, gender, poverty, income, education, commuting, employment, rent, home ownership, housing value, size of housing, heating systems, and even bathrooms. Users can select one or several data items in customized reports and all the data can be exported.
12 geographies covering over 360,000 locations
Census 1980 in 2010 Boundaries gives you access to over 3,500 demographic variables for 11 different geographies. These geograhic areas consist of the following levels (numbers indicate how many specific areas are within that geographic level):
 |
United States (1) |
 |
States (51) |
 |
Combined Statistical Area (CSA) (160) |
 |
Metropolitan Statistical Area (MSA) (1,013) |
 |
106th Congessional District (423) |
 |
American Indian Reservations (406) |
 |
Counties (3,143) |
 |
Census Designated Places (29,261) |
 |
Zip Codes (ZCTA) (31,810) |
 |
Census Tracts (73,057) |
 |
Block Groups (217,740) |
Methodology coming soon, we are still developing the exact weighting parameters.
