1980 Long Form in 2000 Boundaries
↓ Features
↓ Variables
↓ Geography
↓ Methodology
CensusCD 1980 in 2000 Boundaries allows users to access US Census data from 1980 and easily compare it with the 2000 Census data. It is the first and only source of Census data from 1980 that is expressed at all of the 2000 Long Form geographies. The CensusCD 1980 in 2000 Boundaries contains both the 1980 Long Form (STF-3) and Short Form (STF-1) datasets. It includes detailed demographic data about topics such as population, household structure, income, poverty, education level, employment, housing costs, immigration, and other variables. The 1980 in 2000 Boundaries is an invaluable resource for policy makers, community organizations, and researchers who want to analyze the changes that have occurred in the U.S. from 1980 to 2000.
Additionally we have made the 1980 data more accessible than in the straight CensusCD 1980 – because we have normalized the data to the 2000 boundaries it means that the entire country can now be viewed at the Block Group, Tract and MCD level. In the official 1980 census only urban areas had tracts and block groups. We have also added MSA, CMSA, and PMSA geographies, whose concepts were being formed in the late 1970’s and early 1980’s but whose geographic boundaries were not yet assigned in the 1980 census.
Why Normalize 1980 Data to 2000 Geographic Boundaries?Geographic boundaries change from census to census which means if you want to look at the changes in the data from 1980 – 1990 – 2000 then you need to deal not only with the demographic changes but also the geographic ones. By and large, county boundaries are stable over time but tracts and block groups regularly change from one census to the next.
In 1980 there is the additional issue of un-tracted areas that needs to be dealt with. The U.S. Census Bureau only tracted those areas that were considered "urban" or part of a metropolitan area. Below is a map of the entire U.S. with the 1980 tracted areas shown. (Map created by GeoLytics’ CensusCD 1980)
US Census Tracts in 1980
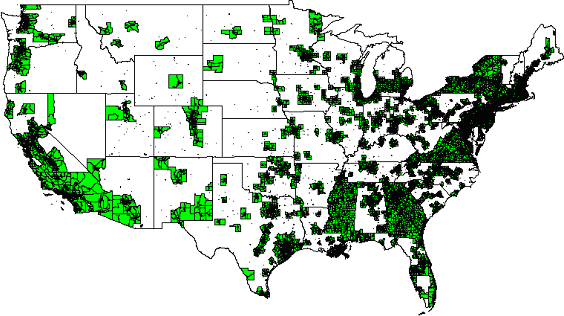
The definition of "metropolitan" has also changed in the past 30+ years. Areas that we now see as the suburbs of large cities were still farming communities in 1980. For example, when we look at the current definition of the Fort Wayne MSA (comprised of Adams, Allen, De Kalb, Huntington, Wells, and Whitley counties) one of the counties was not tracted (Whitley) and another (Huntington) was only partially tracted in 1980.
2000 Fort Wayne MSA with 1980 Tracts Boundaries
2010 Fort Wayne MSA with 2010 Tract Boundaries
This means that if we want to see how the current Fort Wayne, IN metropolitan area has changed, we are missing information for these tracts.
CensusCD 1980 in 2000 Boundaries fixes this problem – we have normalized the data to the 2000 tracts – thus the entire country is tracted. Because we have taken the MCD’s and counties and normalized those areas that weren’t already tracted to the tract and block group, it means that we can now look at the 1980 data at the tract level for the entire country.
Why is normalizing data such a big deal?
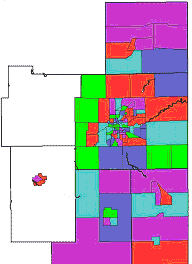
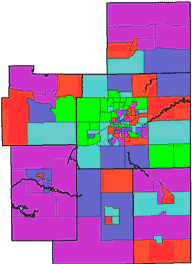
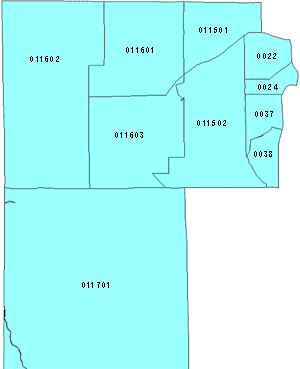
Changing track boundaries mean that it is difficult to compare track data over time. In the example below, a section of Allen County, IN is shown broken-out at the census tract level. At a glance, one can observe that there are changes in the census tracts from 1980 to 2000. In fact, Allen County, IN has a nice example of tracts merging, splitting, and merging/splitting into new parts. Overall, the number of tracts grew from 82 in 1980 to 90 tracts in 2000, a 10% increase.
Subset of Tracts in Allen County, IN in 1980 Boundaries
Subset of Tracts in Allen County, IN in 2000 Boundaries
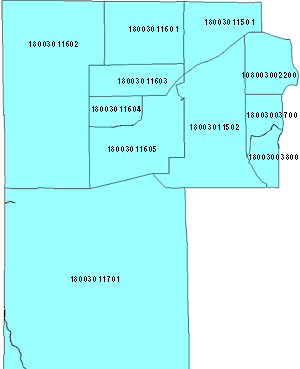
Taking a closer look at Allen County from 1980 to 2000 reveals the modifications in tract boundaries that significantly impact how researchers study and account for changes in a population over time. For example, the single 1980 Tract # 011601 broke into two tracts in the 2000 Census (011601 and 011603). It is a straight-forward 1-to-2 correspondence. There are also mergers where two tracts, 002200 and 002400, merge into 1 tract 002200.
However, the changing tract boundaries from 1980 to 2000 are not always that straight forward. In the next example, tracts 011603 and 011701 merge and then split into three tracts, 011604, 011605 and 011701. The correspondence in this case is 2-to-3. It is made more complicated because if you don’t look carefully it appears that 011701 stays the same, it has the same code and the same general position. It may in fact even have the same centroid lat/long coordinate. But if you look carefully you see that there is a piece of the bottom of 011603 that is no longer part of 011605 but rather has been added to 011701.
There are other more complicated examples that have 2 or 3 tracts merging and splitting into 6 new tracts. From these examples in Allen County, it becomes evident why it is so difficult for researchers to contend with the issue of changing geographic boundaries over time.
Comparison Table
| Basic | |
|---|---|
| State User | $695.00 |
| National User | $1,295.00 |
| Geographic Identifiers STF1A | ✪ 58 variables |
| Geographic Identifiers STF3A | ✪ 292 variables |
CensusCD 1980 in 2000 Boundaries includeds both the 100% count (STF-1) and the Long Form (STF-3) data, down to the block group level in one convenient source. CensusCD 1980 in 2000 Boundaries gives you over 1,500 demographic variables for every Block Group, Tract, Place, Minor Civil Division (MCD), County, and State, as well as for the Nation as a whole. It covers 1980 population and housing attributes with data on age, race, ancestry, gender, poverty, income, education, commuting, employment, rent, home ownership, housing value, size of housing, heating systems, and even bathrooms. Users can select one or several data items in customized reports and all the data can be exported.
Geography
CensusCD 1980 in 2000 Boundaries makes it easy to select specific geographic areas of interest to customize your project. All of the data is given in 2000 geographic boundaries as if the 2000 boundaries had existed when the 1980 census was taken. Our program allows you to select geographies across state lines, so for example if you need information on tracts for one county in Maine and three in California and another two in New York, you can have data for all of the tracts in all 6 of these counties all in one report. More importantly the program will automatically break down one or more larger areas into component units. For instance getting New York, Ohio and Pennsylvania reported by tract, place, or county is a snap. Compare this to data vendors who only provide raw data and want to sell you only one state or county at a time. CensusCD 1980 in 2000 Boundaries has data at 12 levels of geography:
Nation (1)
State (51)
County (3,141)
Tracts (65,232)
Block Groups (208,790)
Places (25,150)
MCD/CCD (35,164)
Congressional districts (436)
Zip (ZCTA) (32,232)
MSA/CMSA (280)
CMSA/PMSA (76)
American-Indian Reservations (651)
In 1980 the country was not fully tracted, in fact only about 80% of the population (and 50% of the land) was within these tracted areas. Block Groups accounted for even less of the areas.
Methodology
Normalizing the Data
The actual re-mapping procedure for converting data from 1980 to 2000 boundaries is quite complicated. The basic procedure was done in two steps. First, create the correspondence file between 1990 and 2000 and then create one from 1980 to 1990. One of the issues with normalizing the data is determining which dataset to use. For example, in 1980 the sum of the MCD’s in a county is not always equal to the county numbers. Likewise the sum of the tracts is not always equal to the MCD’s or counties. In part this is due to data suppression (see below) and in part it is due to census tabulation irregularities. The computer system the US Census Bureau was running on in 1980 was not powerful enough to allow them to do many of the cross checks that we now take for granted. Thus what we decided to do was to use the smallest level of geography for which there was coverage in that area. We used tract level data for 80%, MCD level data for 19% and had to resort to county level data for the remaining 1%. When we normalized the dataset we selected the source and then distributed the data to the 2000 geographies. Thus in the CensusCD 1980 in 2000 Boundaries, Block Groups sum to Tracts which sum to MCDs which sum to Counties which sum to States.
Special Issues Relating to MCDs
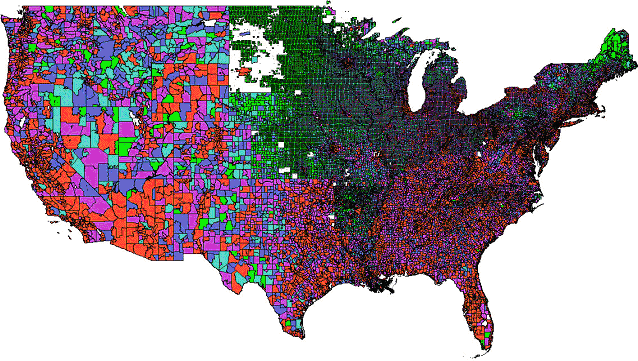
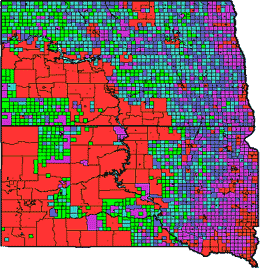
There are a few exceptions where the MCDs are not in alignment. The problem is that the TIGER 1992 file associates 1990 blocks with 1980 tracts, 1980 counties, and 1980 MCD FIPS codes. But, the 1980 MCD data is stored at the MCD census code level. Therefore you then need to consult the Census Bureau’s 1980 MCD FIPS to Census code correspondence file. Some of these correspondences are mis-aligned, thus causing the problem. Additionally, when we look at the map of the 1980 MCD geography there are some holes in the map (see below). There is supposed to be complete coverage of the U.S. at the MCD level. These holes are caused by errors in the TIGER 92 relationship file. Quite frankly, they are holes in the data correspondance that therefore cannot be properly mapped. By normalizing the data to the 2000 MCD geographic definitions we solve this error as well, as the maps below demonstrate.
MCD map of the U.S. in 1980 Boundaries (created by GeoLytics’ CensusCD 1980 Long Form)
Close up view of MCDs in South and North Dakota in 1980 Boundaries
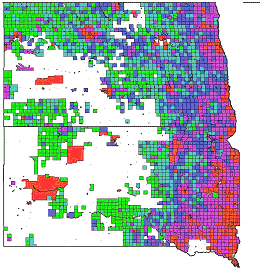
Close up view of MCDs in South and North Dakota (created by GeoLytics’ CensusCD 1980 in 2000 Boundaries)
Data Suppression in 1980
Many of the questions on the Long Form (STF-3) are personal and the US Census Bureau works very hard to ensure that no individual or household is identifiable. This means that when the answers to many of the questions are too few, the data is suppressed. Some data, like Race or Age Grouping, are not suppressed because there is a sense that you can tell by looking at someone their age category or their race. But other issues, like income, are carefully guarded. Thus if there are only 2 Asian families the Census Bureau will not give you family income by race for Asians. The numbers will just be zeroed out.
Because of this suppression the sum of the tracts in a county that is fully tracted may not be the same as the county level numbers. Likewise, the sum of Block Groups may not be the same as the Tract or County numbers.
When we went to distribute the data from the 1980 MCD or county to the 2000 tract and block group levels there are times that the suppression of data affects the summary of these numbers. This means that the MCD or county numbers from the CensusCD 1980 in 2000 Boundaries may differ from the 1980 Long Form MCD or county numbers even if there was no change in the geography.
Weighting and converting the 1980 Census data to 1990 geographies
The 1980 census data was weighted and converted first to 1990 block groups. Then this 1980 data in 1990 block groups were weighted and converted to the 12 different 2000 geographic areas.
In order to normalize the 1980 data to the 1990 geographies we used the relationship tables produced by the US Census Bureau that were released in a product called TIGER92. These relationship tables link up 1990 Block groups, with 1980 tracts, MCD’s, and counties.
In 1980 tracts are found in primarily urban areas. The Census Bureau had designated tracted areas for only about 50% of the country’s area that covers about 80% of the population. It is desirable to weight and convert 1980 data from the smallest geography. So, in this case we used the tract. There are some Block Groups in the most urban areas, but because of the higher quality of the geographic associations in TIGER92 we used the Tract. But we still had to deal with the areas that are outside of “tracted areas” therefore, it became necessary to use the next smallest area, the MCD. The smaller (more detailed) area, the tract, was used for about 80% of the population coverage, while MCD was used for about 19%. Where there was not tract coverage, and where TIGER92 associations for 1980 MCD’s were missing, county level data was used, about 1% of the cases.
Specific relationships of 1990 Block groups to 1980 tracts, MCD’s and counties were used to allow a weighting by 1990 block population to 1990 block group areas.
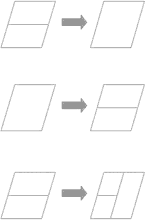
We used the Tiger/Line 2000 relationship between 2000 blocks with 1990 blocks. This allowed us to identify how block boundaries had changed between censuses. For example, some 1990 tracts split into two for the 2000 census, other tracts merged, while some tracts both merged and then split. The table below shows the three scenarios (many to one, one to many, and many to many).
There are 8.2 million blocks in the US in 2000, so in fact these are very small geographic areas. But in order to be more precise, when necessary we broke blocks down. When the blocks split then the matter of how to split the population becomes a problem. (When they merge you just add the numbers). In order to determine how to subdivide blocks we looked at the Tiger Street files. The assumption being that people live on or near streets, so the number of addresses on a street will indicate the approximate weight to give to that area of the block.
From the blocks or block parts we created a Block Weighting File. These population weights were then applied to the various other counts to convert them to 2000 block boundaries. Once the data had been calculated at the block level we were then able to sum up the blocks to the various other geographies. Testing was then done to assure the accuracy and validity of the weighting method compared with the original numbers.
A final weighting consideration should be noted, the weighting of 1980 data to 2000 areas has been done as statistically accurately as possible. The 1980 STF1 and STF3 data is the official Census data and our methodology presents an accurate and comprehensive method to statistically compare 1980 data with 2000 data. However, the converted 1980 data in 2000 boundaries cannot be considered official census data. While a major obstacle to comparing altered geographic areas has been overcome, those areas that have not changed between 1980 and 2000 may contain rounding differences in the weighting process and may not exactly match the official census.


